
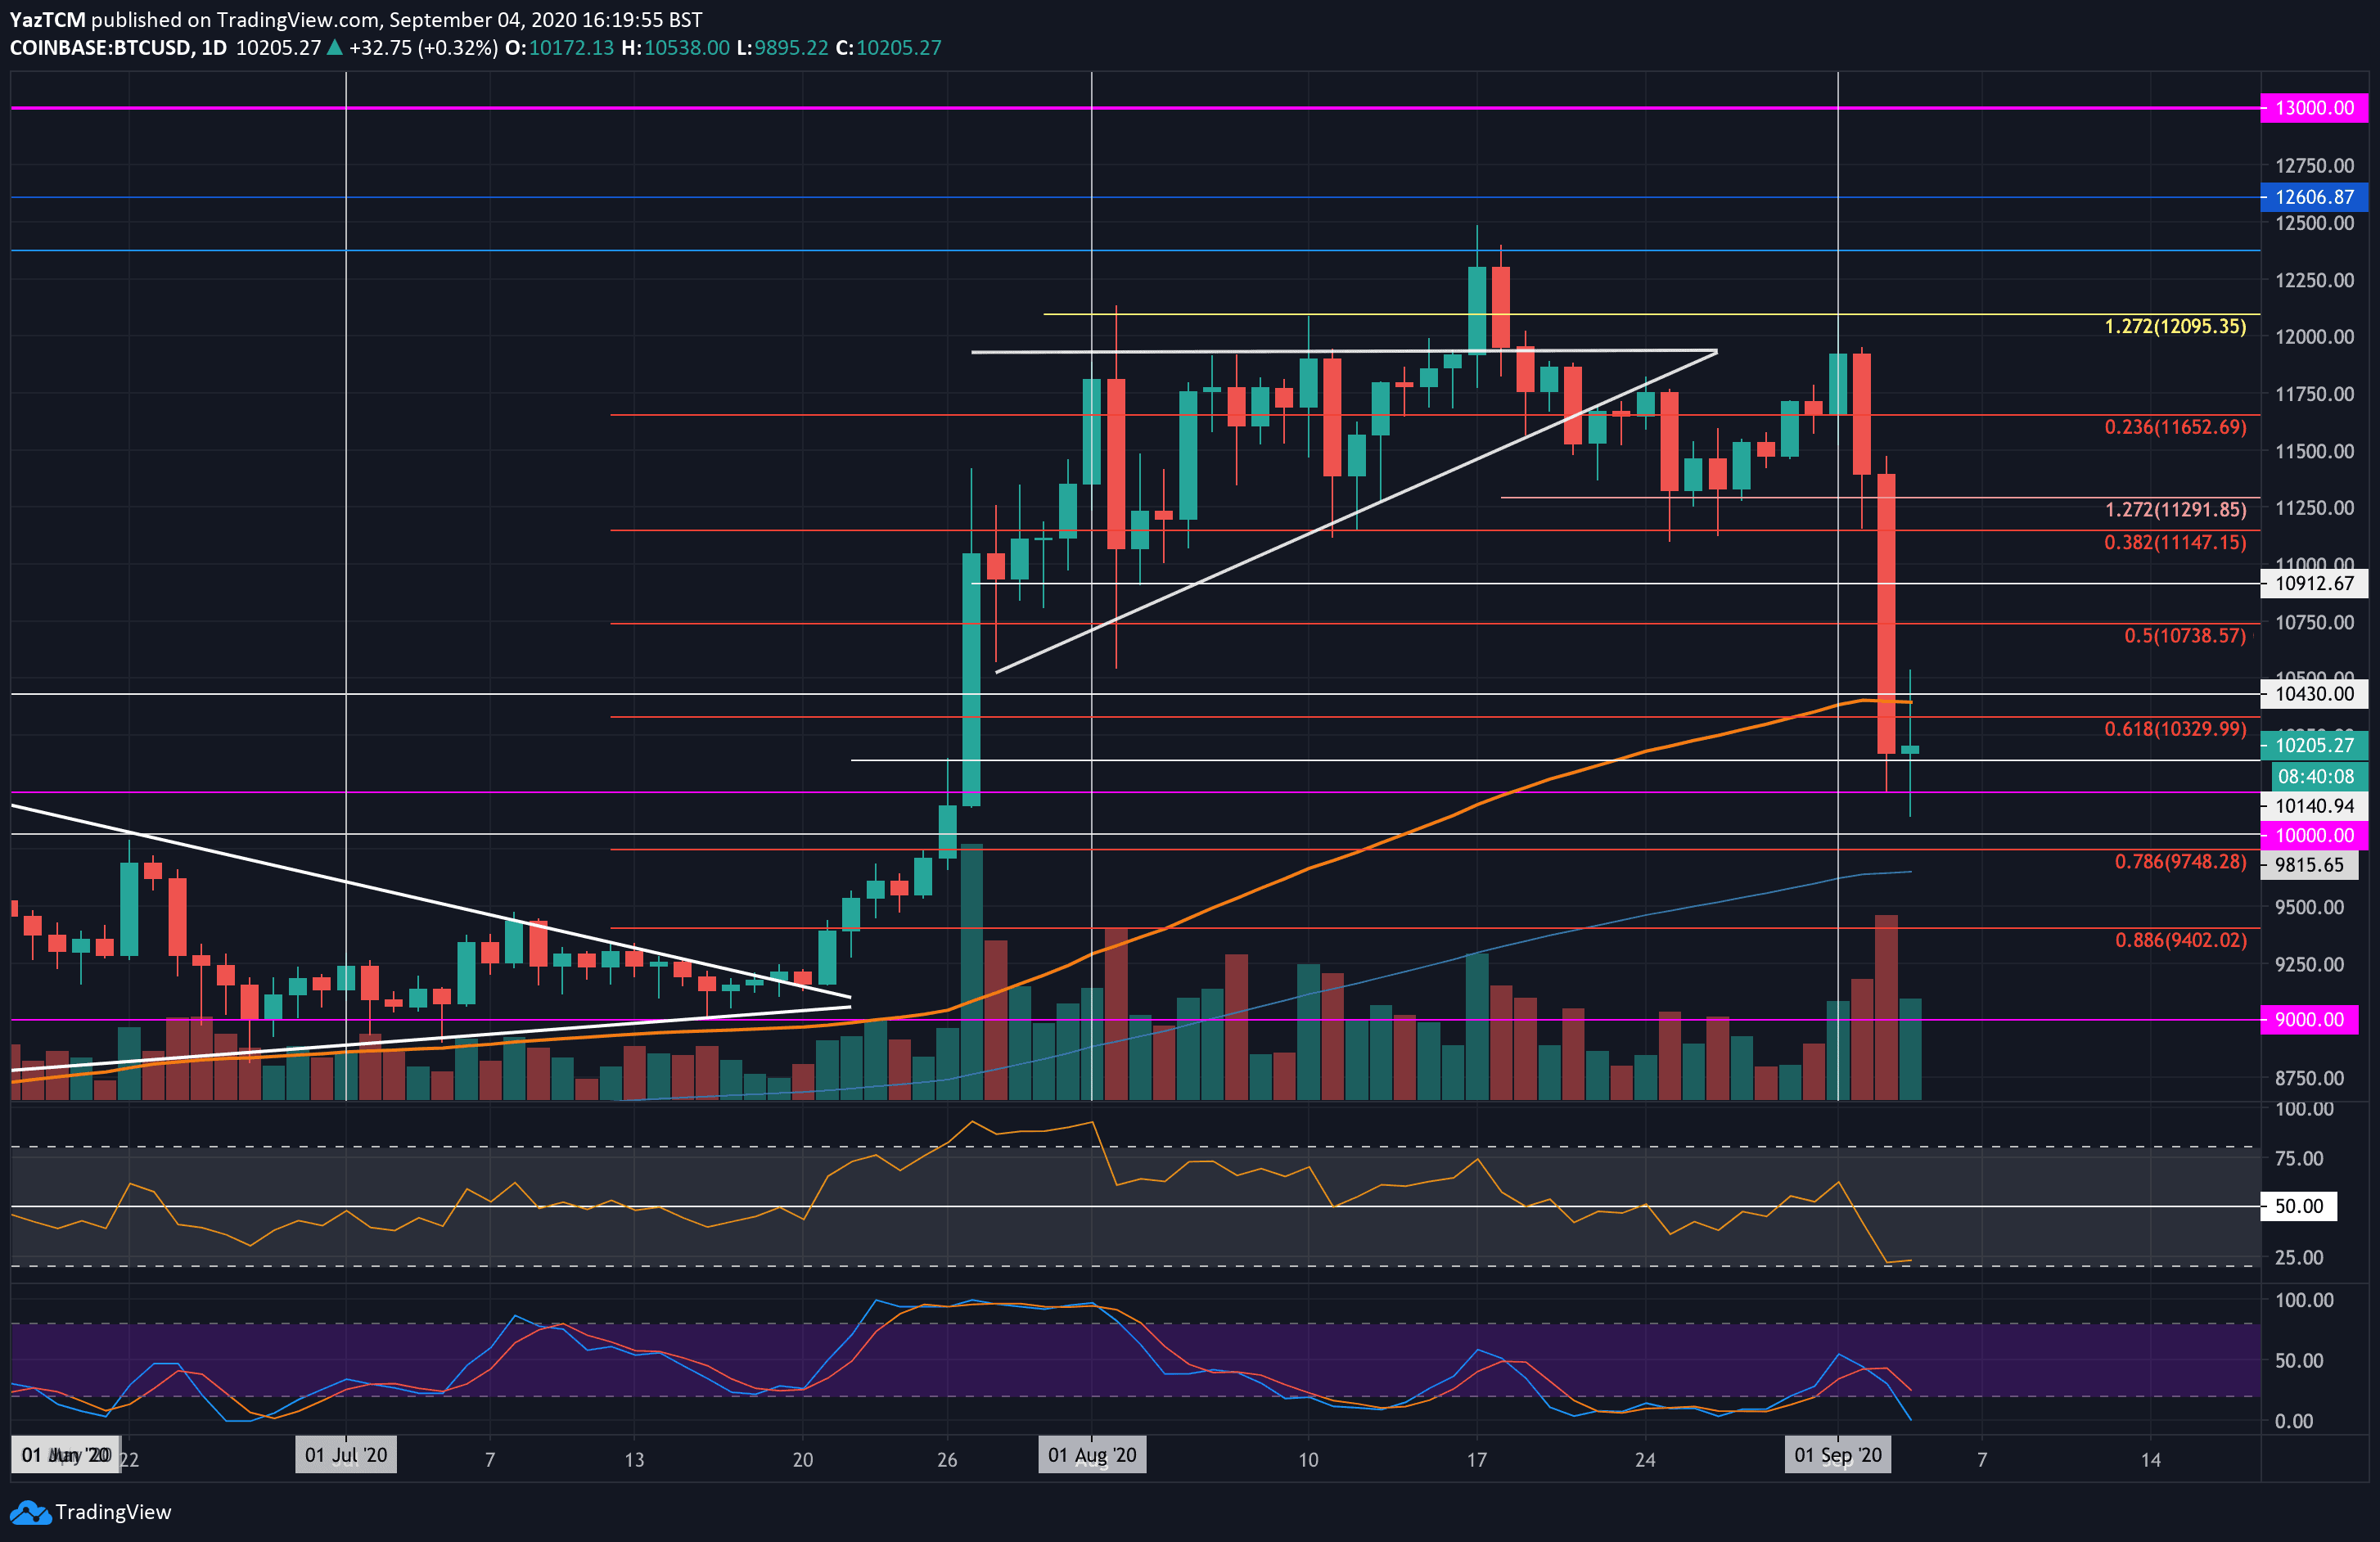
Bitcoin (BTC)
Bitcoin saw a steep 10.6% price decline this week as it hit the current $10,250 level. The cryptocurrency had started September off with a bullish tone as it managed to spike above the $12,000 level. However, this changed two days ago as Bitcoin started to roll over.
It initially found support at $11,150 (.382 Fib Retracement), but this level was penetrated in yesterday’s trading session when BTC fell from $11,500 to reach $10,000. The coin closed yesterday’s candle at the $10,140 level. However, today, Bitcoin spiked well beneath $10,000 as it reached $9,875. It has since rebounded to trade back above $10,200.
This now puts Bitcoin at a new 5-week low.
Looking ahead, if the bulls can recover and push back above $10,430 (100-day EMA), resistance lies at $10,600, $10,750, $10,910, and $11,000. Following this, resistance is found at $11,150, and $11,300.
On the other side, if the sellers break beneath $10,140, support lies $10,000. Beneath $10K, added support is found at $9,815, $9,750 (.786 Fib Retracemnet), and $9,600 (200-day EMA).
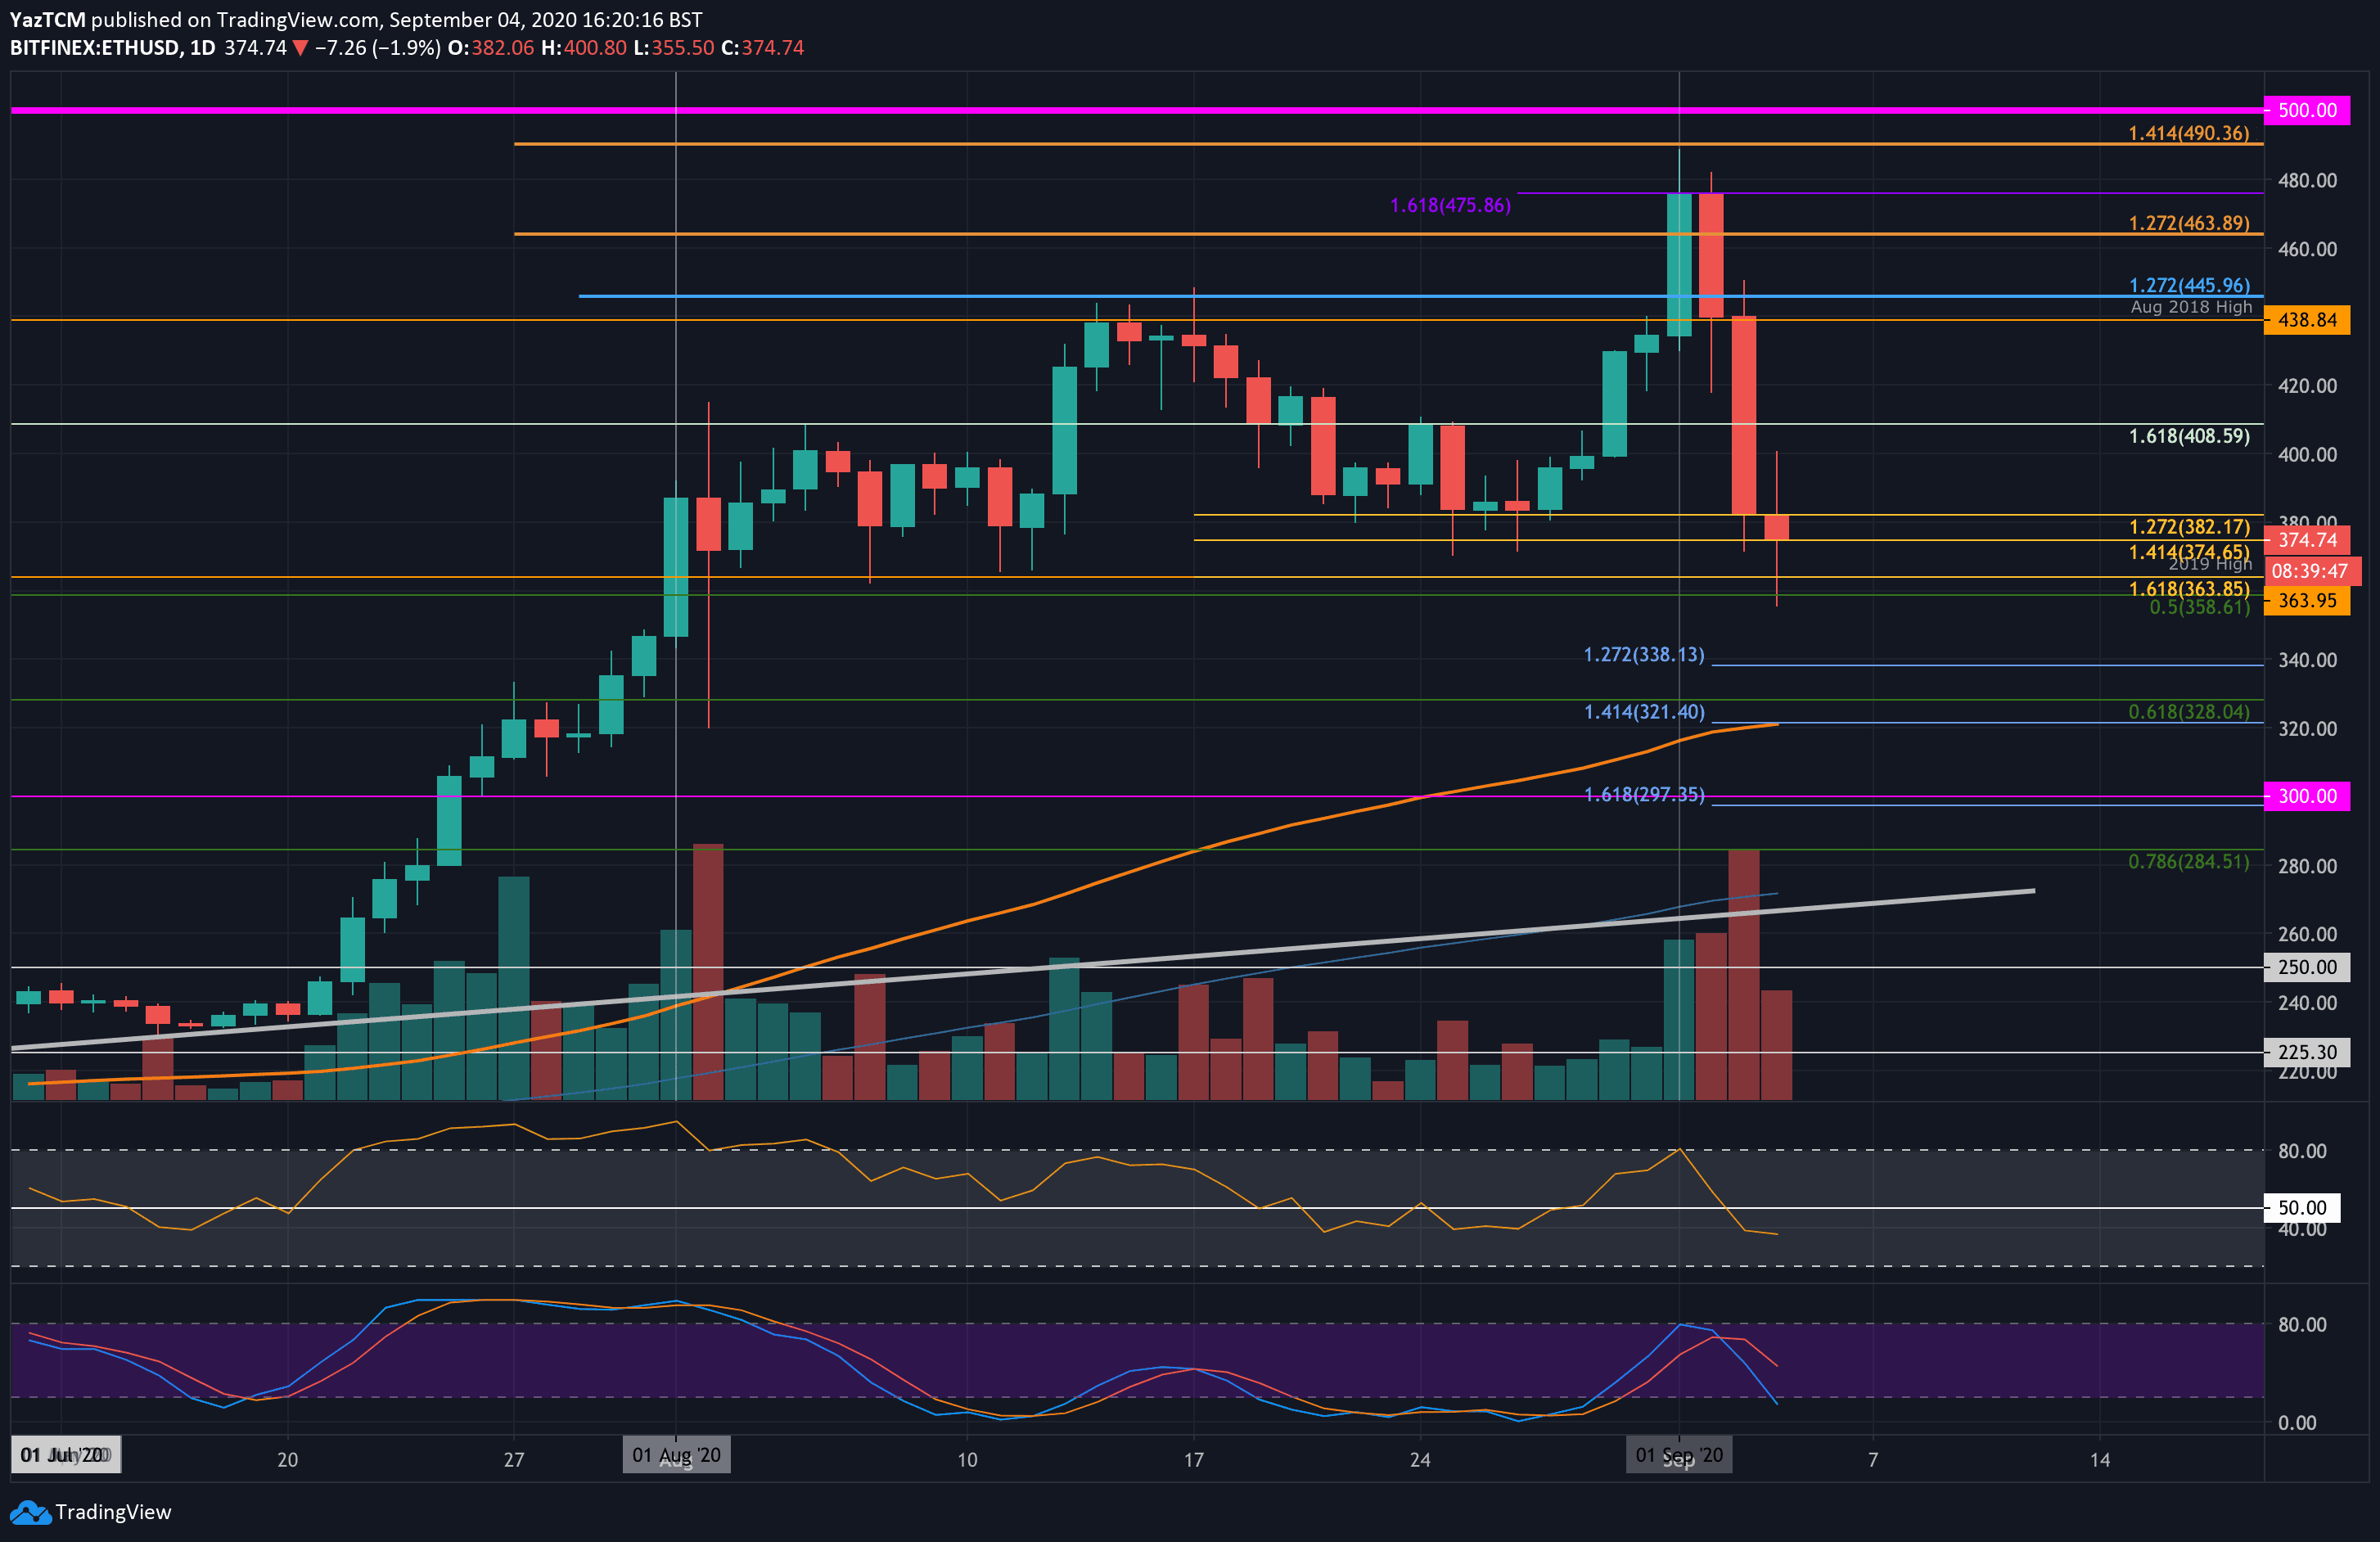
Ethereum (ETH)
Despite falling back beneath the $400 level, Ethereum only dropped by a small 4.5% over the past week. During the last seven days, it managed to rise as high as $490 on September 1st. More specifically, the coin was unable to close the daily candle above the $476 resistance as it started to reverse.
Ethereum initially found support at $438 (August 2018 highs). However, this support was penetrated yesterday as it headed into the $382 level (downside 1.272 Fib Extension). Today, Ethereum fell further beneath the $382 support and spiked as low as $360. However, the bulls are now trying to defend the support at $375 (downside 1.414 Fib Extension).
Looking ahead, if the bulls can penetrate above $382, resistance lies at $400, $410, $420, and $440. Following this, resistance is found at $450, $463, and $475.
On the other side, support is first expected at $75 (downside 1.414 Fib Extension). This is followed by added support at $365 (2019 high), $358 (.5 Fib Retracement), and $250.
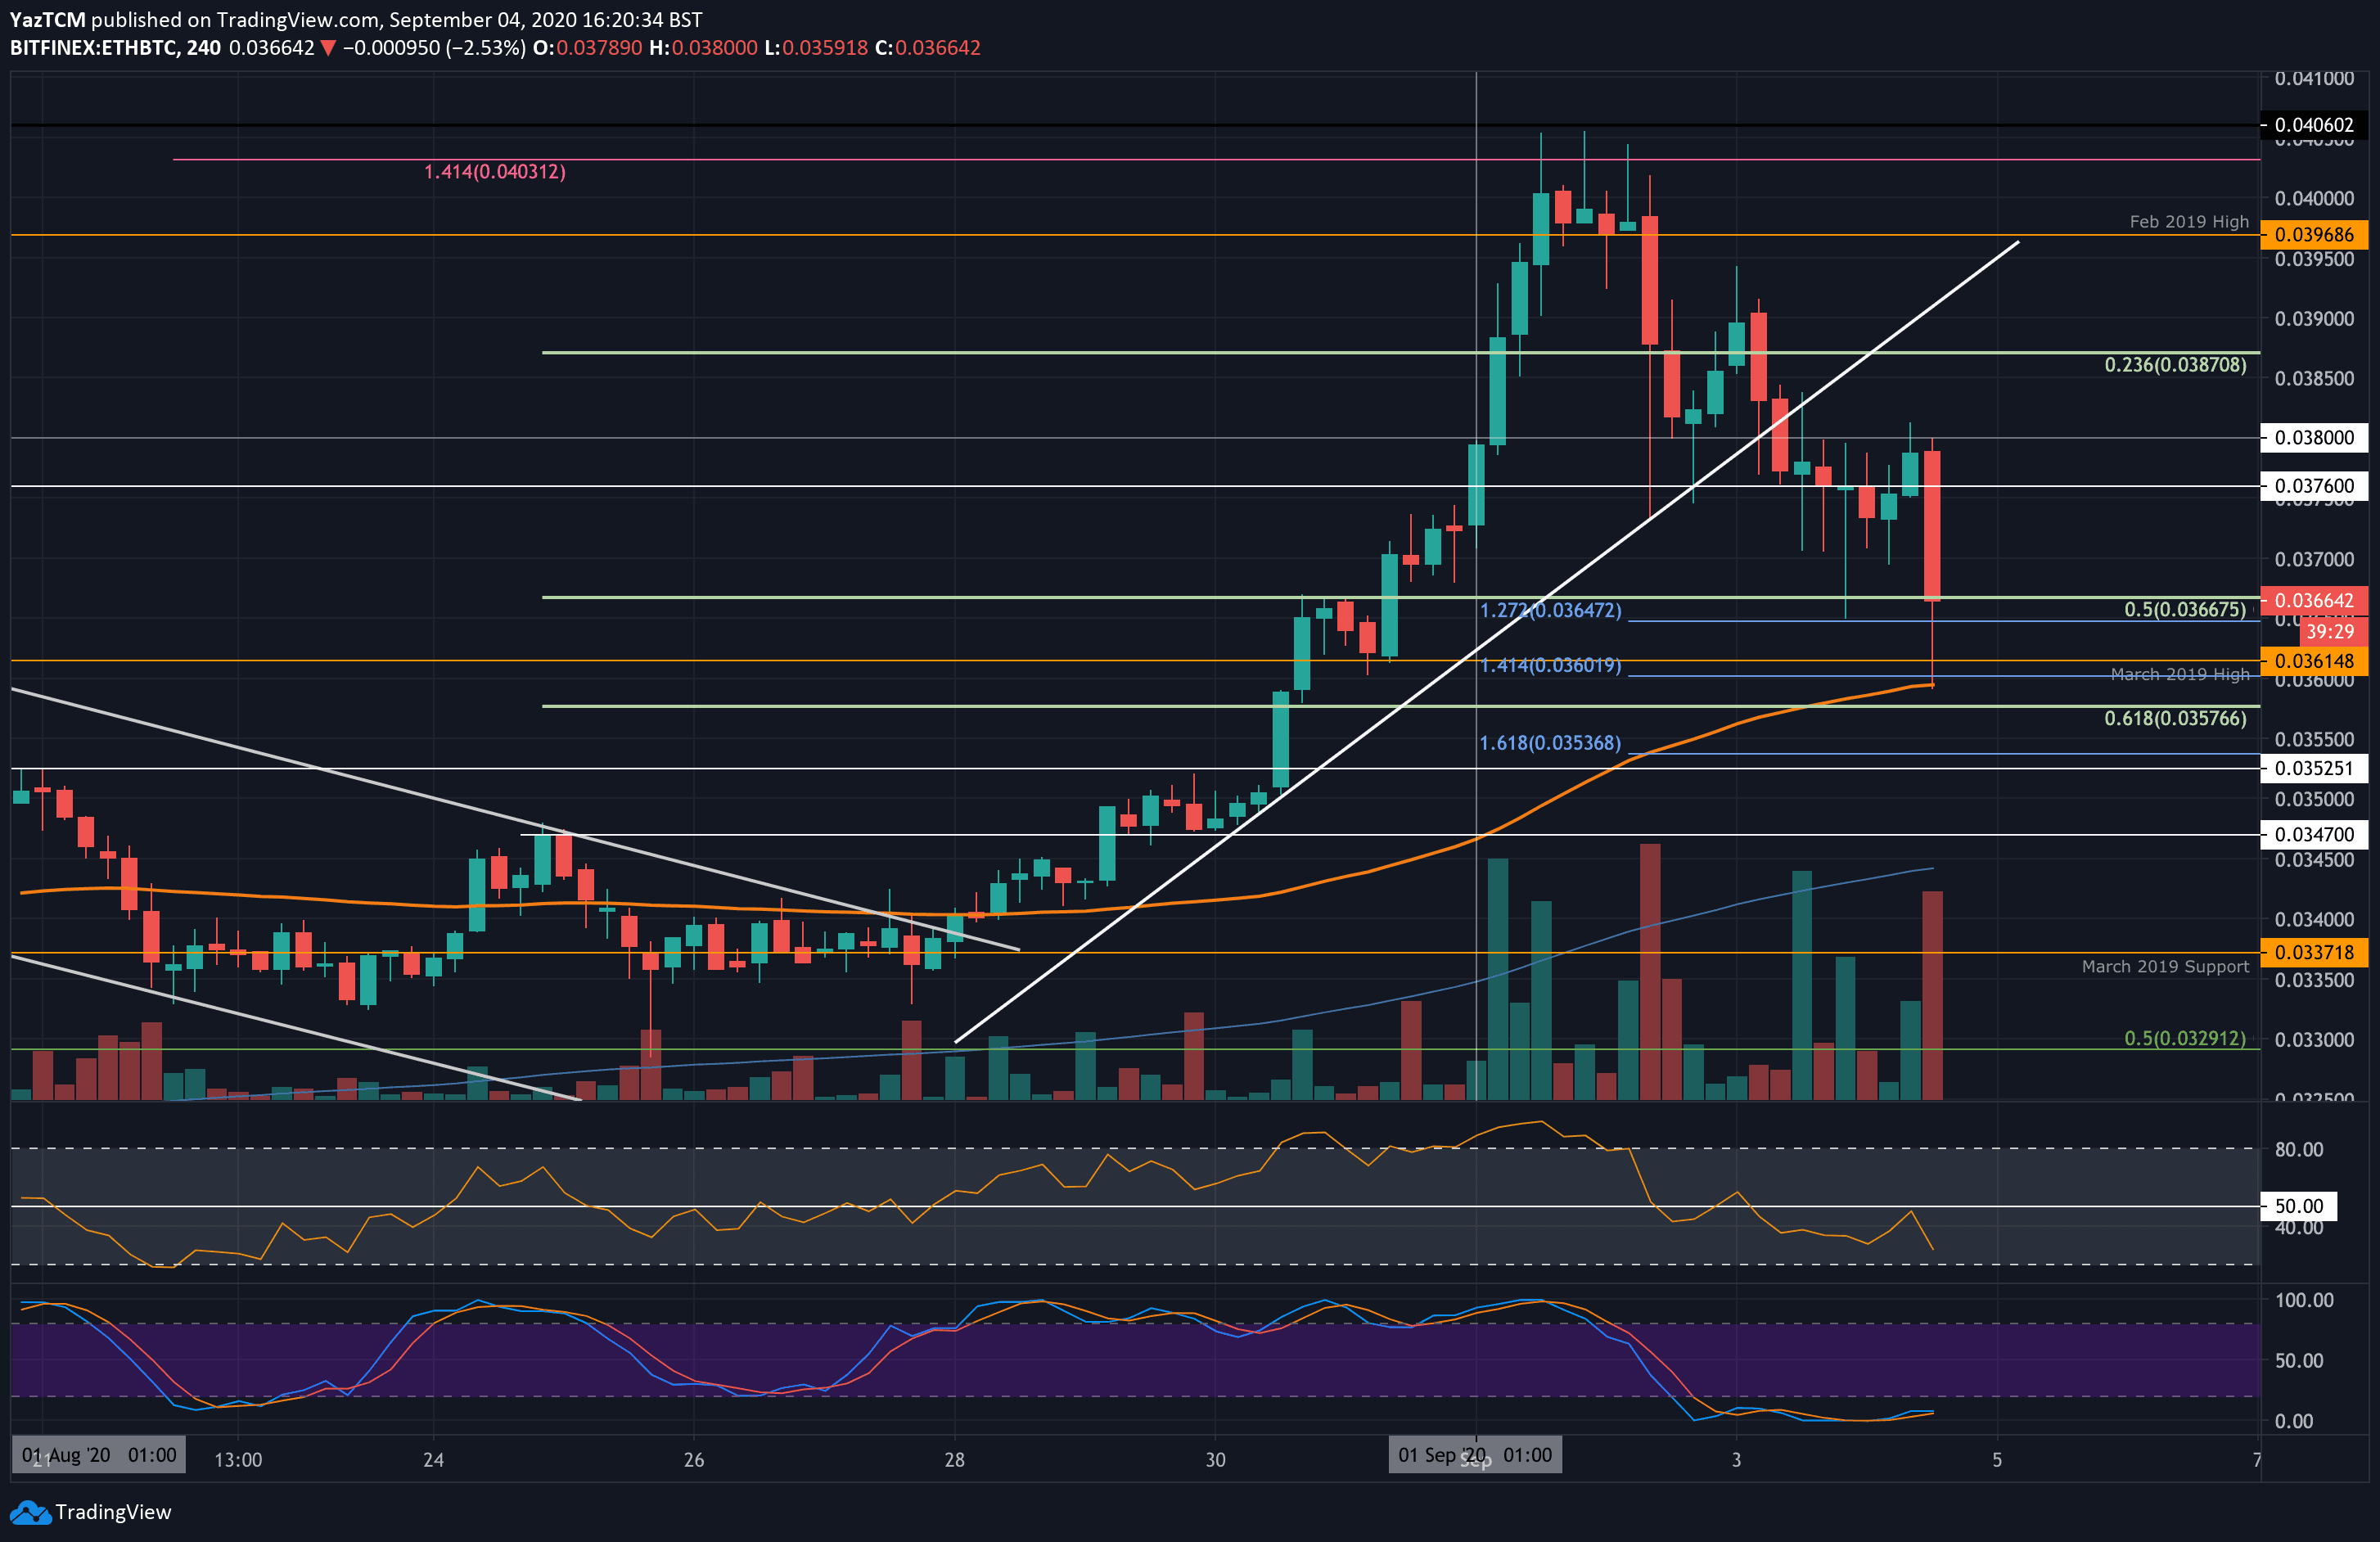
Ethereum is performing slightly better against Bitcoin. At the start of September, ETH managed to rise into the 0.04 BTC level. From there, it started to head lower as the bulls attempted to defend a rising trend line.
Unfortunately, this trend line broke over the past couple of days as ETH dropped into the 0.0037 BTC support. It has continued beneath this today as it spiked as low as 0.036 BTC. The bulls have since recovered to the 0.0366 BTC level (.5 Fib Retracement).
Looking ahead, if the buyers can head higher and break 0.037 BTC, resistance is located at 0.0376 BTC, 0.038 BTC, 0.0385 BTC, 0.0387 BTC, and 0.0396 BTC (Feb 2019 High). Above 0.04 BTC, resistance lies at 0.0406 BTC.
On the other side, the first level of support lies at 0.0366 BTC (.5 Fib Retracement). Following this, support lies at 0.0361 BTC (March 2019 High), 0.0367 BTC (.618 Fib Retracement), and 0.0352 BTC.
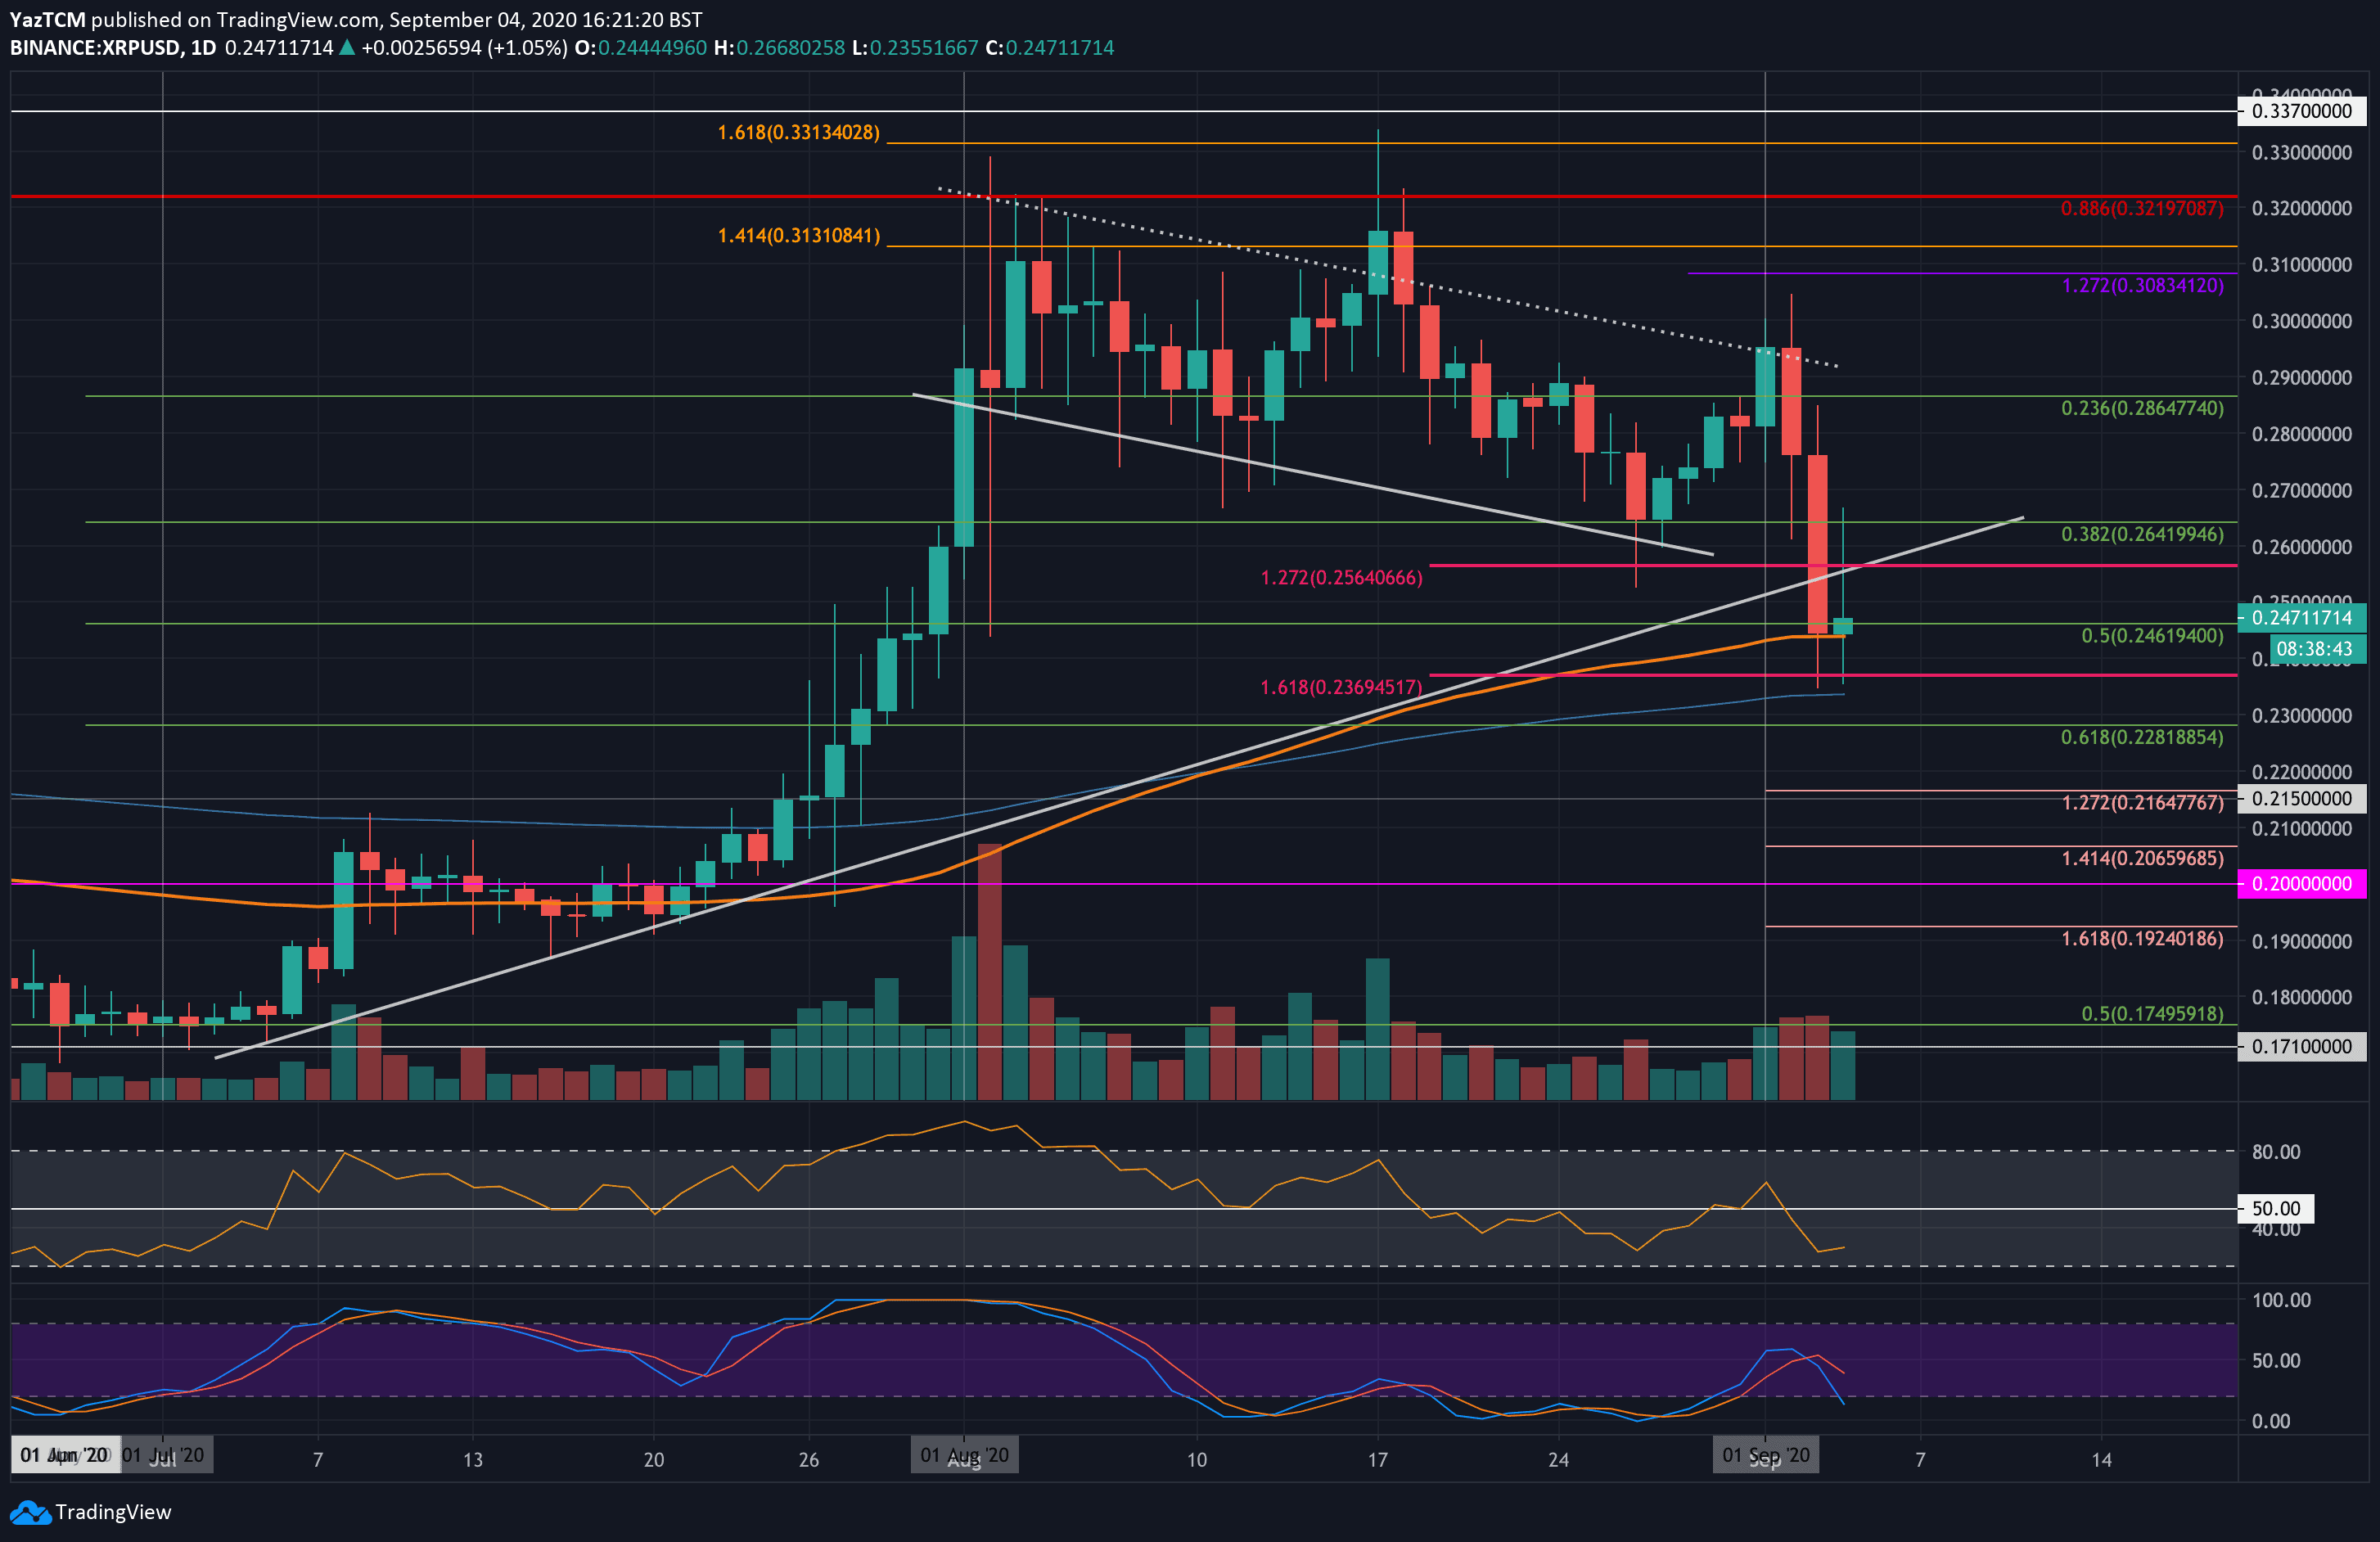
Ripple (XRP)
XRP dropped by a steep 8% this week as it hit the $0.247 level. The coin rebounded from the support at $0.264 last week, which allowed it to spike above the $0.3 level in early September. However, the steep market drop in Bitcoin caused it to break back beneath $0.3 quickly.
Yesterday, XRP penetrated beneath a rising trend line but managed to close the candle at the 100-day EMA at around $0.245. From there, the bulls have attempted to rebound as they trade just beneath $0.25.
Looking ahead, if the bulls break above $0.25, resistance lies at $0.256, $0.264, $0.27, and $0.28.
On the other side, support is first expected at $0.245 (100-day EMA). Following this, support lies at $0.236 (downside 1.618 Fib Extension), $0.235 (200-day EMA), and 0.228 (.618 Fib Retracement).
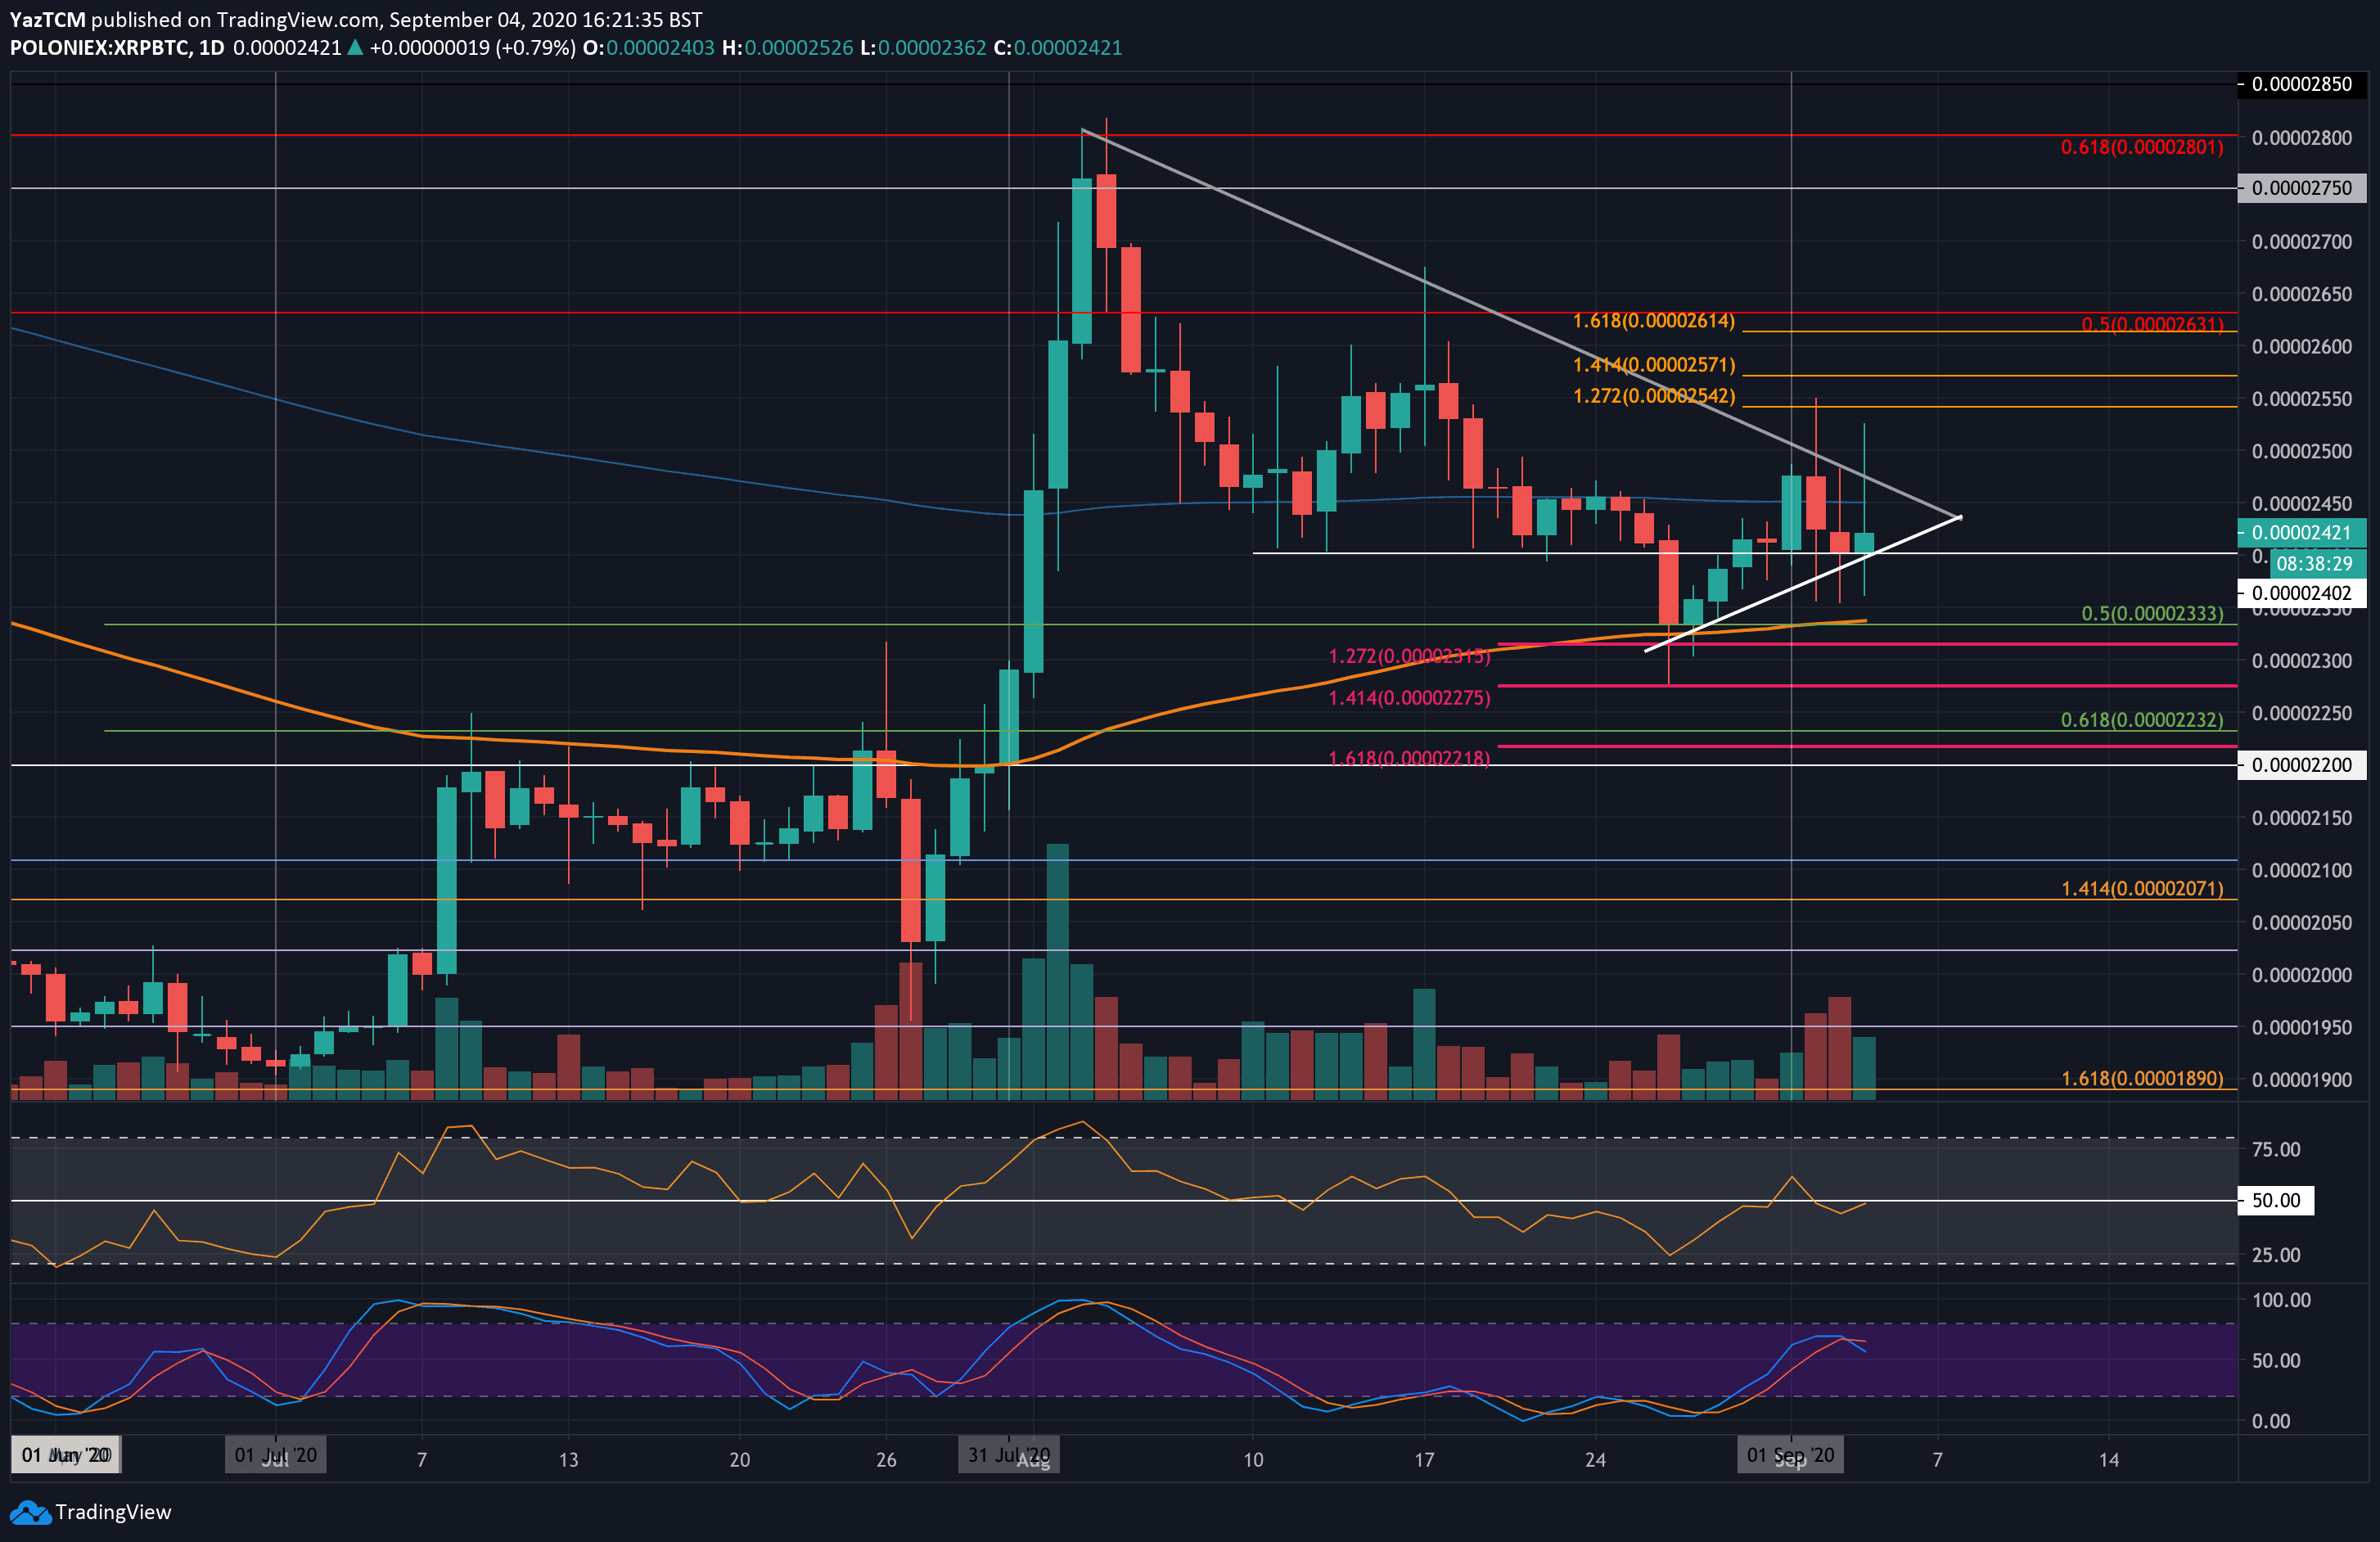
Against Bitcoin, XRP bounced from 2333 SAT last week as it started to push higher. XRP did not suffer significantly against Bitcoin in the previous few days of price decline. The buyers managed to defend the 2400 SAT level and remained above a very short term rising trend line.
XRP has rebounded today as it trades at 2420 SAT and now faces resistance at a falling trend line that has been active since early-August 2020.
Looking ahead, if the bulls can break the trend line, resistance lies at 2542 SAT, 2571 SAT, and 2630 SAT (bearish .5 Fib Retracement). This is followed by strong resistance at 2700 SAT, 2750 SAT, and 2800 SAT (bearish .618 Fib Retracement).
On the other side, if the sellers push lower, the first level of support lies at 2400 SAT. Beneath this, support lies at 2333 SAT (100-days EMA & .5 Fib Retracement), and 2275 SAT.
Tron (TRX)
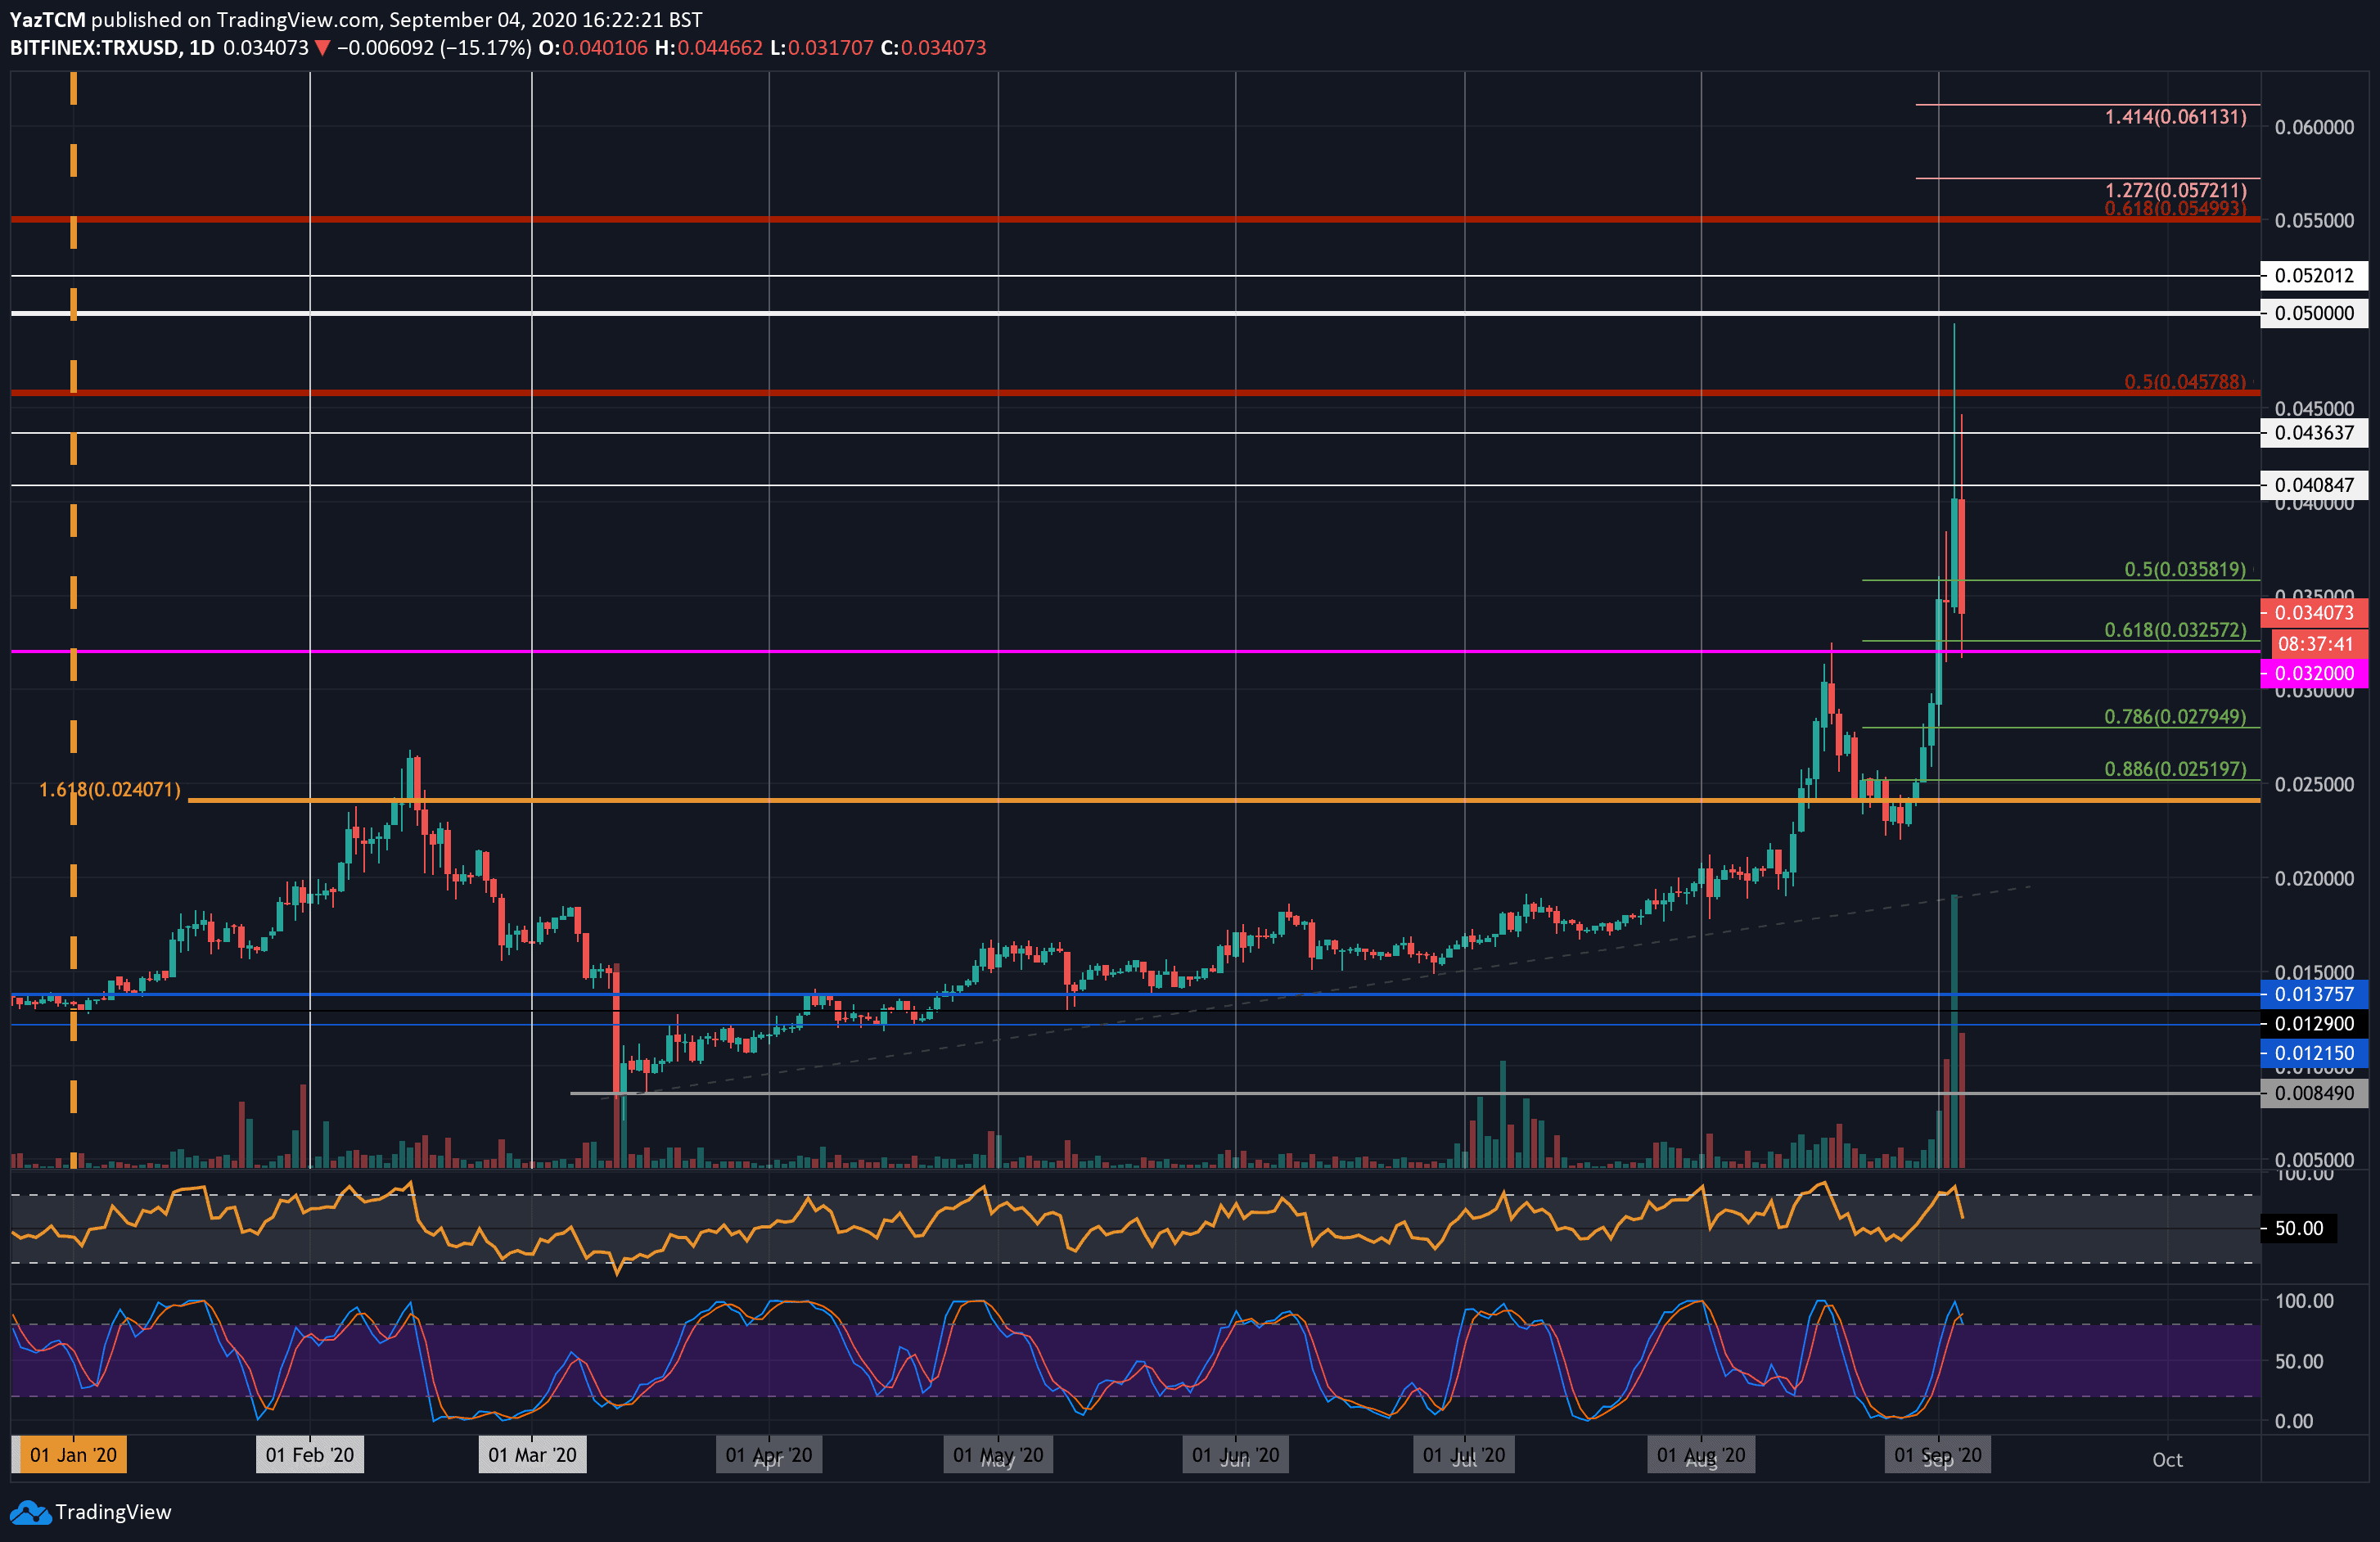
TRXis moving in the opposite direction to the market after it surged by a total of 40.6% this week. It is the only top 15 ranked project to see some substantial positive price movement during the week.
Tron started the week by trading beneath the $0.025 level as it began to push higher. It quickly broke above the August high at $0.032 in September and continued to reach the $0.05 level yesterday. Unfortunately, it was unable to close yesterday’s daily candle above $0.04 as it headed lower.
Today, TRX found support at the .5 Fib Retracement $0.0358, but the recent BTC price spike beneath $10,000 caused it to fall to the current $0.034 level.
Looking ahead, if Tron heads lower, support lies at $0.0325 (.618 Fib Retracement), $0.03, and $0.0279 (.786 Fib Retracement). Added support is found at $0.0251 and $0.2.
On the other side, the first level of resistance to overcome lies at $0.04. Above this, resistance is found at $0.0436, $0.0457 (bearish .5 Fib Retracement), and $0.05.
Against Bitcoin, Tron also managed to surge significantly higher. The coin reached as high as 460 SAT yesterday, but was unable to close the daily candle above 400 SAT (bearish .786 Fib Retracement). TRX has since dropped lower as it trades around 330 SAT.
Looking ahead, if the sellers break below 330 SAT, support is found at 321 SAT (.382 Fib Retracement), 300 SAT (.5 Fib Retracement), and 275 SAT (.618 Fib Retracement).
On the other side, resistance is located at 350 SAT, 370 SAT, 400 SAT (bearish .786 Fib Retracement), and 430 SAT (bearish .886 Fib Retracement).

Tezos (XTZ)
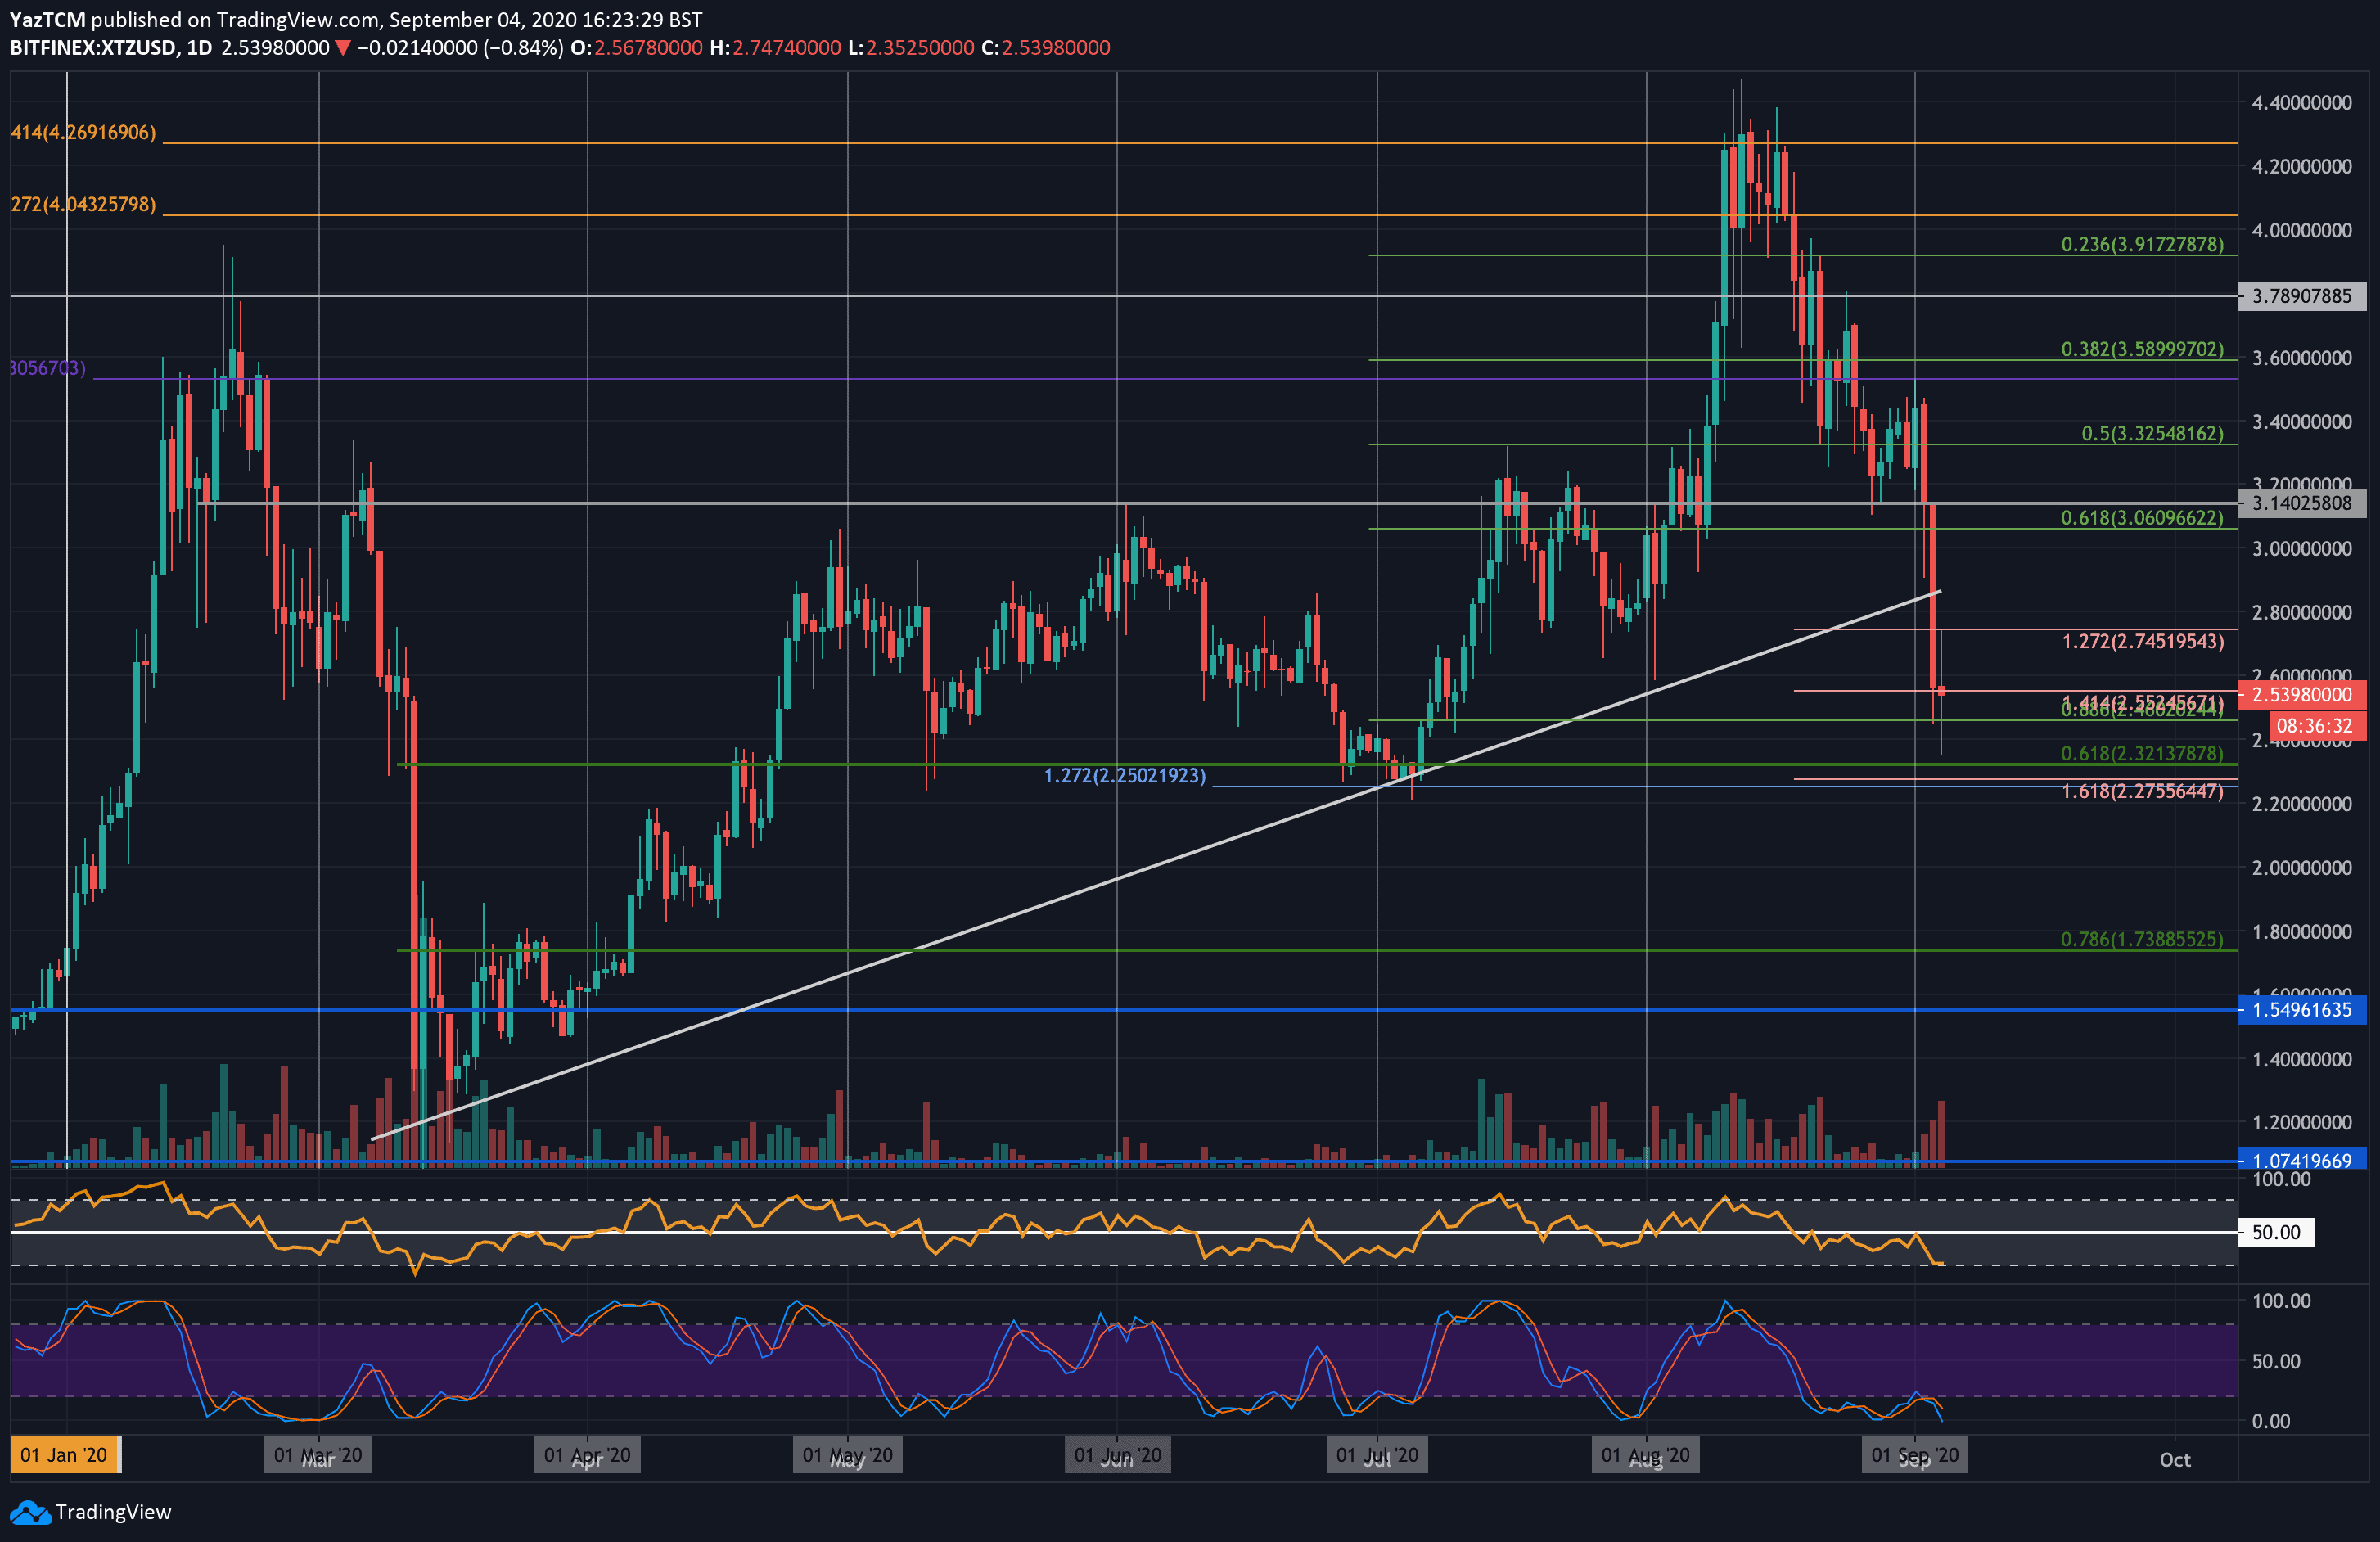
Tezos suffered a massive 22% price plummet over the last week of trading as it reaches the current $2.50 level. It was trading at the $3.50 level toward the start of September, but things took a turn for the worst. From there, XTZ started to head lower as it broke beneath $3.00 yesterday to reach as low as $2.45.
Luckily, the bulls managed to hold the support at $2.55 (downside 1.414 Fib Extension) as they attempt to hold it today. XTZ did spike further lower toward $2.40 but has since jumped back above $2.50.
Looking ahead, if the bulls push higher, resistance lies at $2.60, $2.80, $3.00, and $3.15.
On the other side, support lies at $2.45 and $2.32. This is followed by support at $2.20 and $2.00.
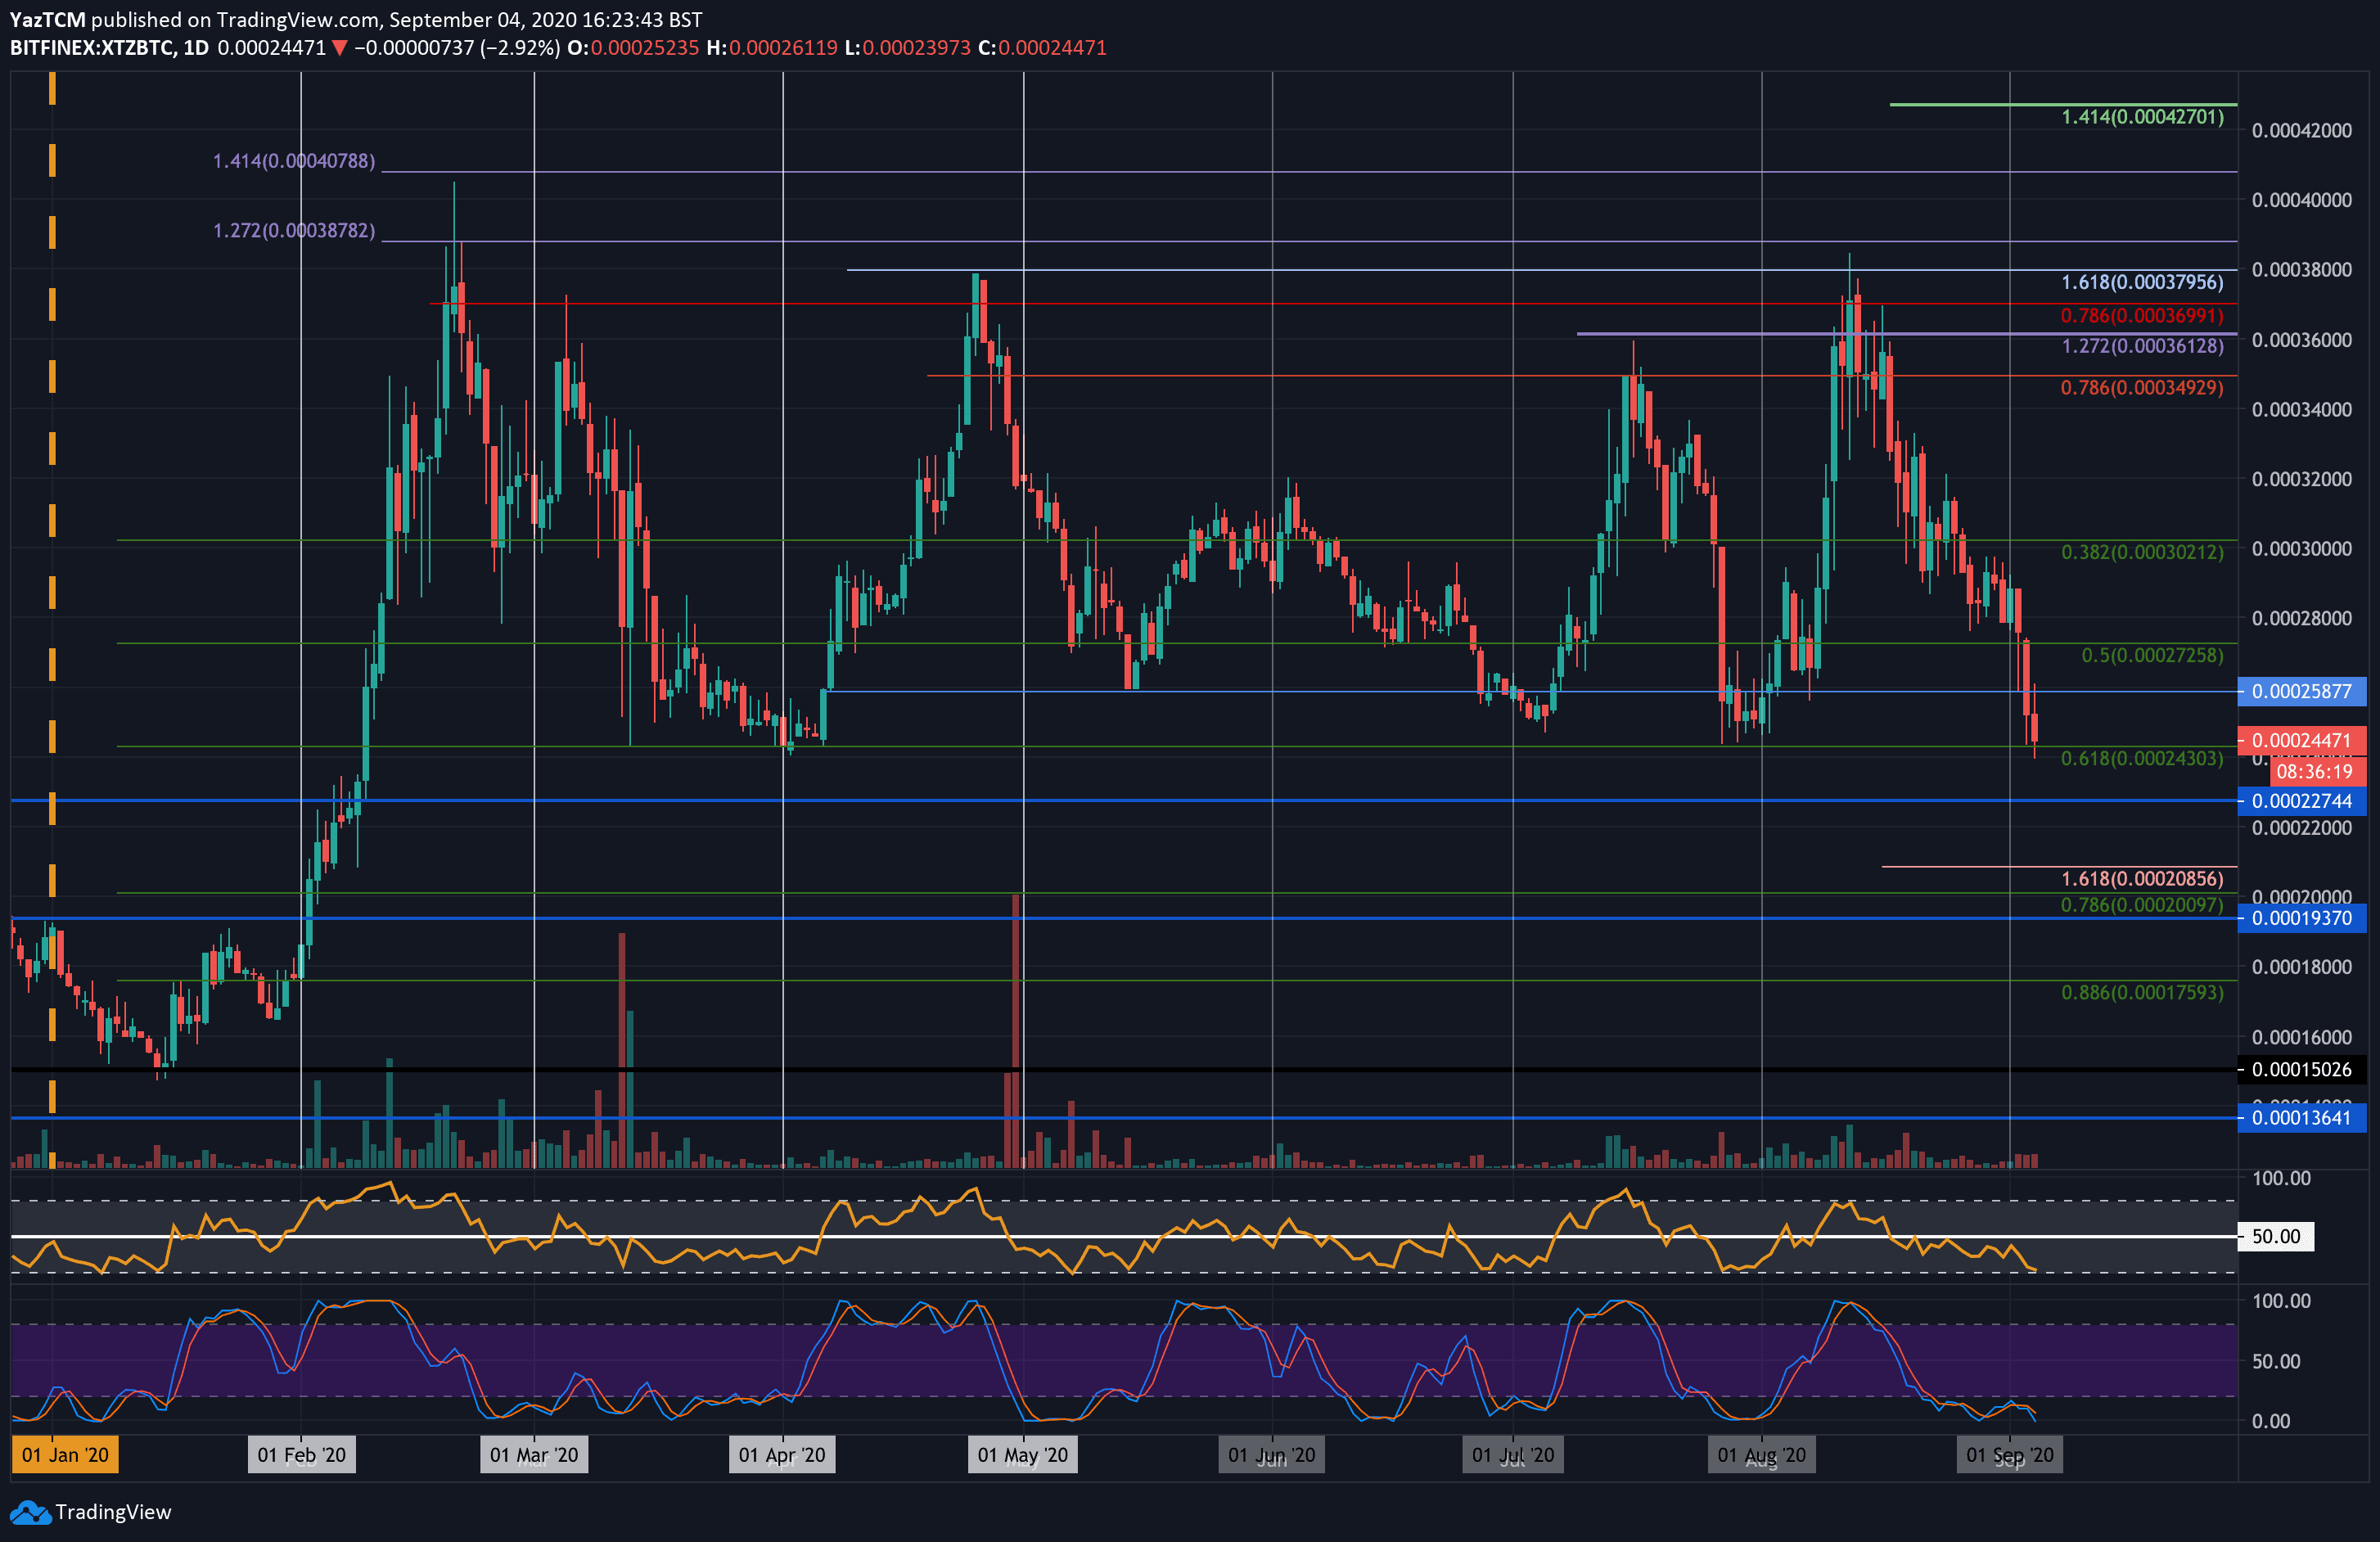
The situation is relatively similar in Tezos against Bitcoin. XTZ was trading at around 29,000 SAT at the start of September as the coin started to head lower. Today, it found support at the 24,300 SAT level (.618 Fib Retracement) as the buyers attempt to defend the level.
Looking ahead, if the buyers can break above 26,000 SAT, resistance lies at 27,200 SAT, 28,000 SAT, and 30,000 SAT.
On the other side, the first level of support lies at 24,300 SAT (.618 Fib Retracement). Beneath this, support lies at 22,700 SAT, 22,000 SAT, and 20,800 SAT (downside 1.618 Fib Extension).
Click here to start trading on BitMEX and receive 10% discount on fees for 6 months.
Disclaimer: Information found on CryptoPotato is those of writers quoted. It does not represent the opinions of CryptoPotato on whether to buy, sell, or hold any investments. You are advised to conduct your own research before making any investment decisions. Use provided information at your own risk. See Disclaimer for more information.
The post appeared first on CryptoPotato


