
ETH/USD – Etheruem Bulls Rebound Beyond 2019 Highs
Key Support Levels: $350, $336, $325.
Key Resistance Levels: $378, $390, $400.
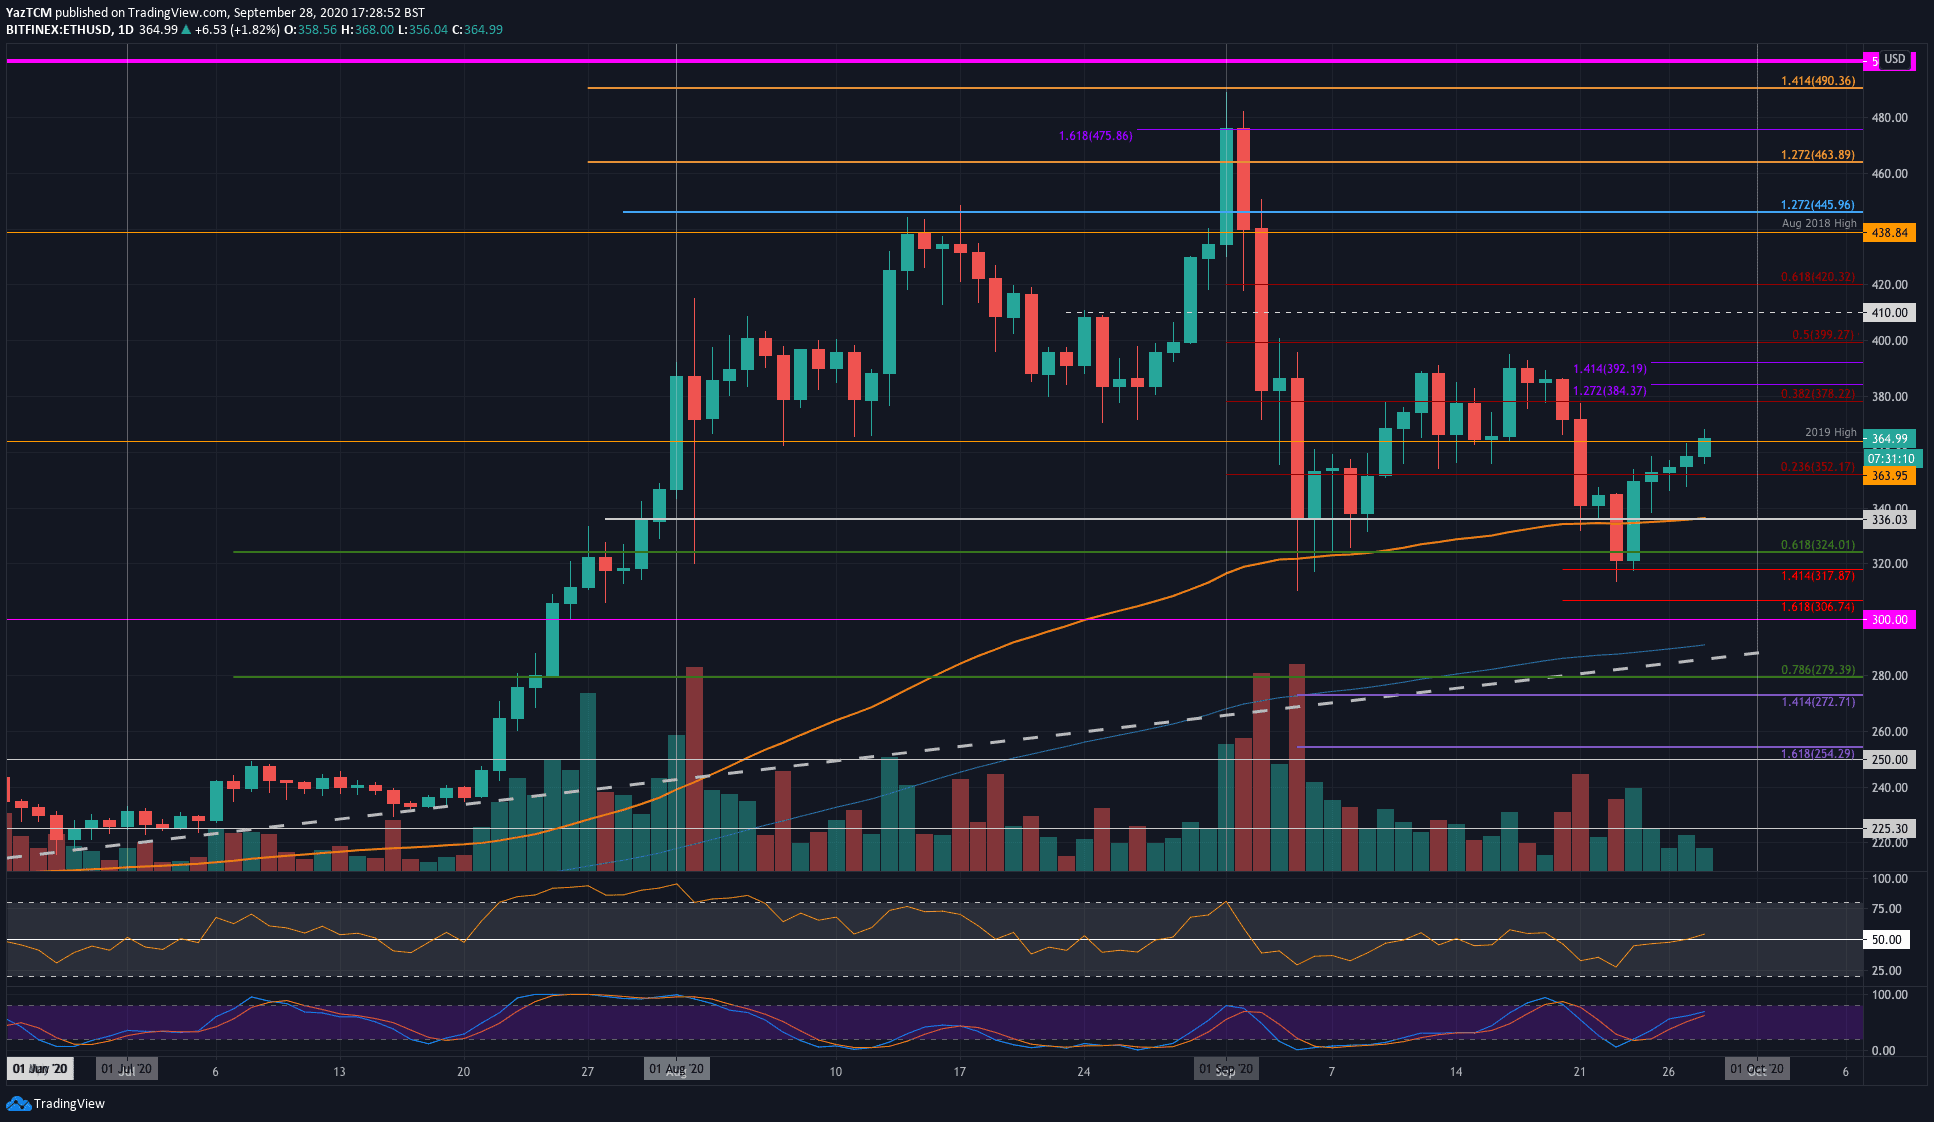
Last week, Ethereum dipped beneath the 100-days EMA as it slipped into the $320 support. From there, the bulls defended this support level, which produced a bullish engulfing candle on Thursday.
From there, Ethereum followed Bitcoin and continued to slowly grind higher over the weekend and eventually managed to push above the 2019 high at $364 today.
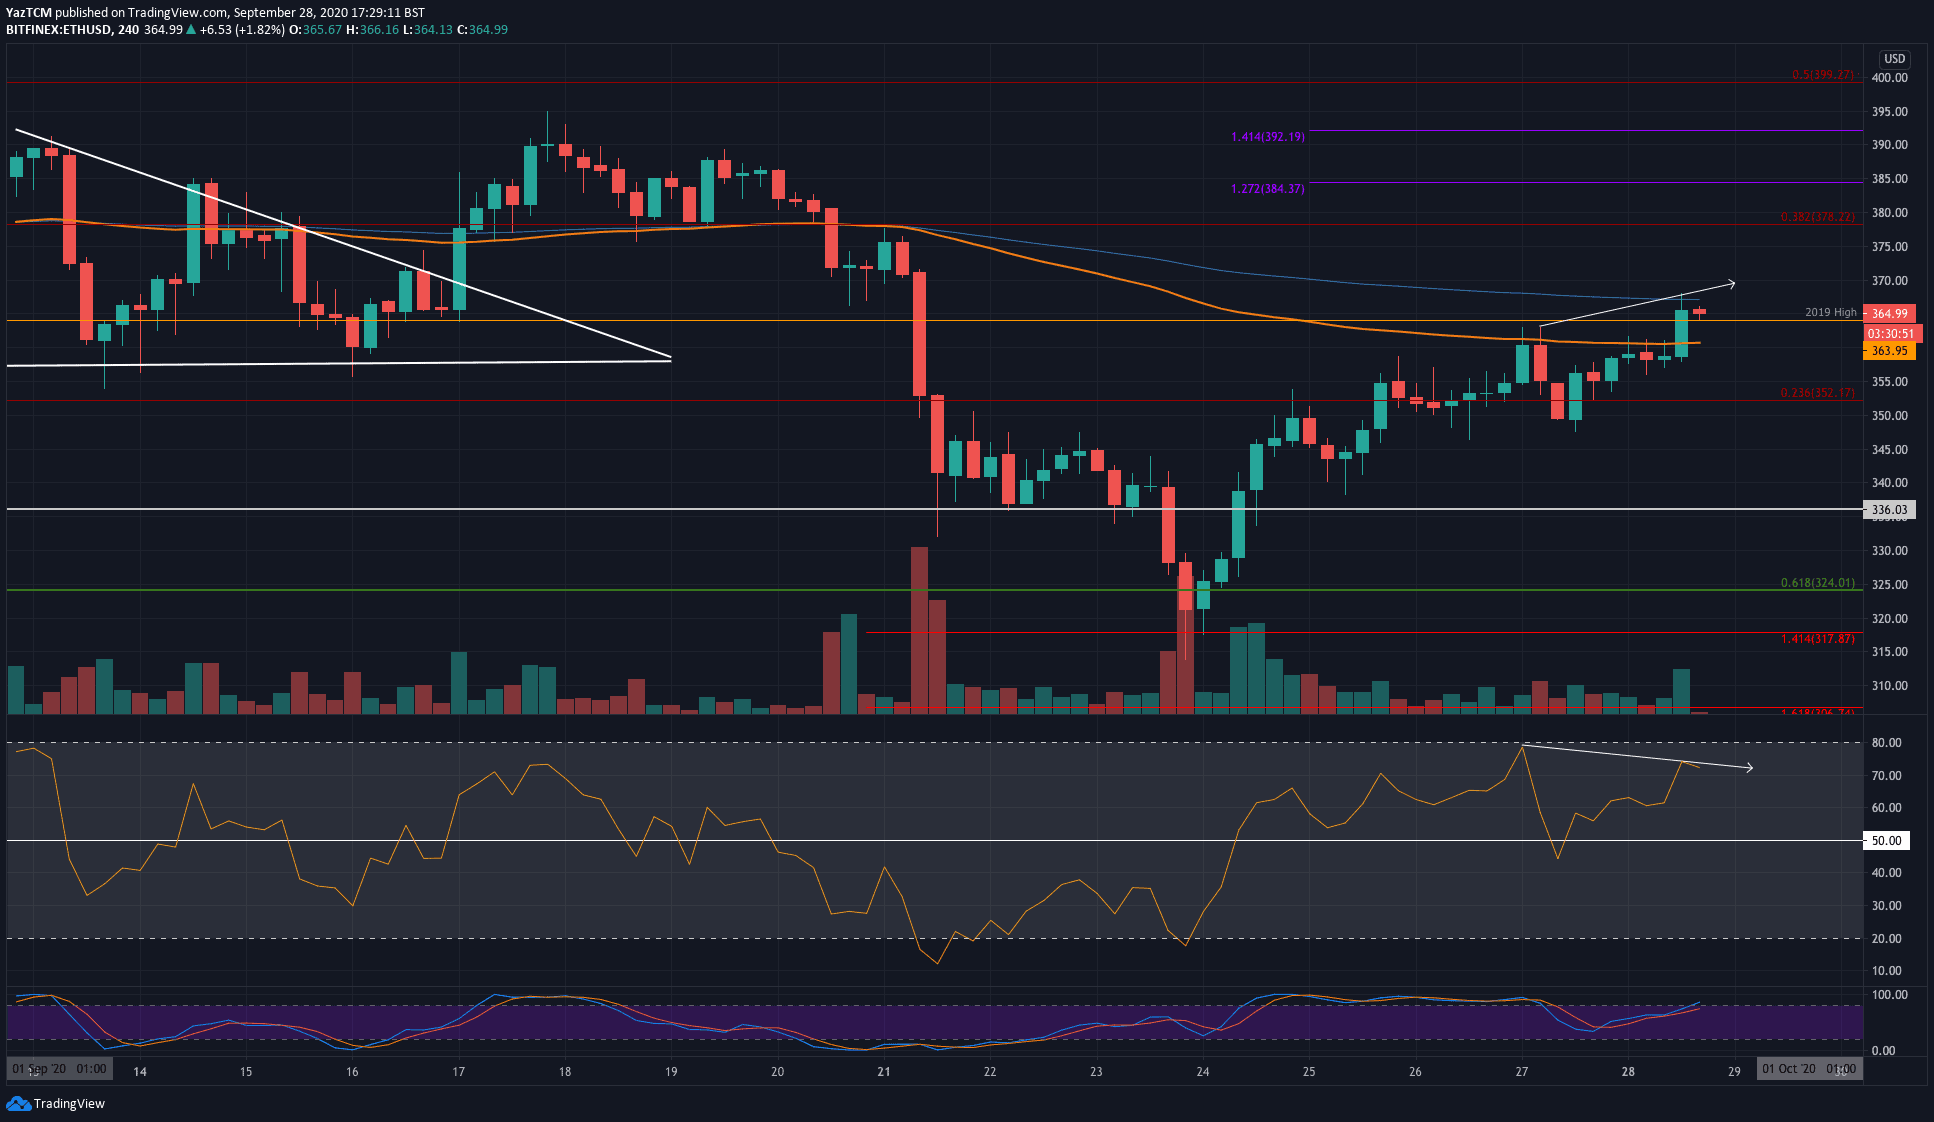
Despite the bullishness, it is essential to note that, on the lower timeframe chart below, there is some evidence that there is some bearish divergence starting to form between price action and the RSI indicator. As price action is making a higher-high, the RSI indicator makes a lower high – known as a bearish divergence.
ETH-USD Short Term Price Prediction
Looking ahead, if the bearish divergence plays out, the market would inevitably head lower. In this case, the first level of support lies at $350. Following this, support lies at $336 (100-days EMA), $324 (.618 Fib Retracement), and $320.
On the other side, if the buyers continue to drive further beyond $365, resistance is first located at $378 (bearish .382 Fib Retracement). Above this, resistance lies at $390 and $400.
ETH/BTC – The Descending Trend Line Resistance
Key Support Levels: 0.033 BTC, 0.032 BTC, 0.0315 BTC.
Key Resistance Levels: 0.0347 BTC, 0.0352 BTC, 0.0361 BTC.
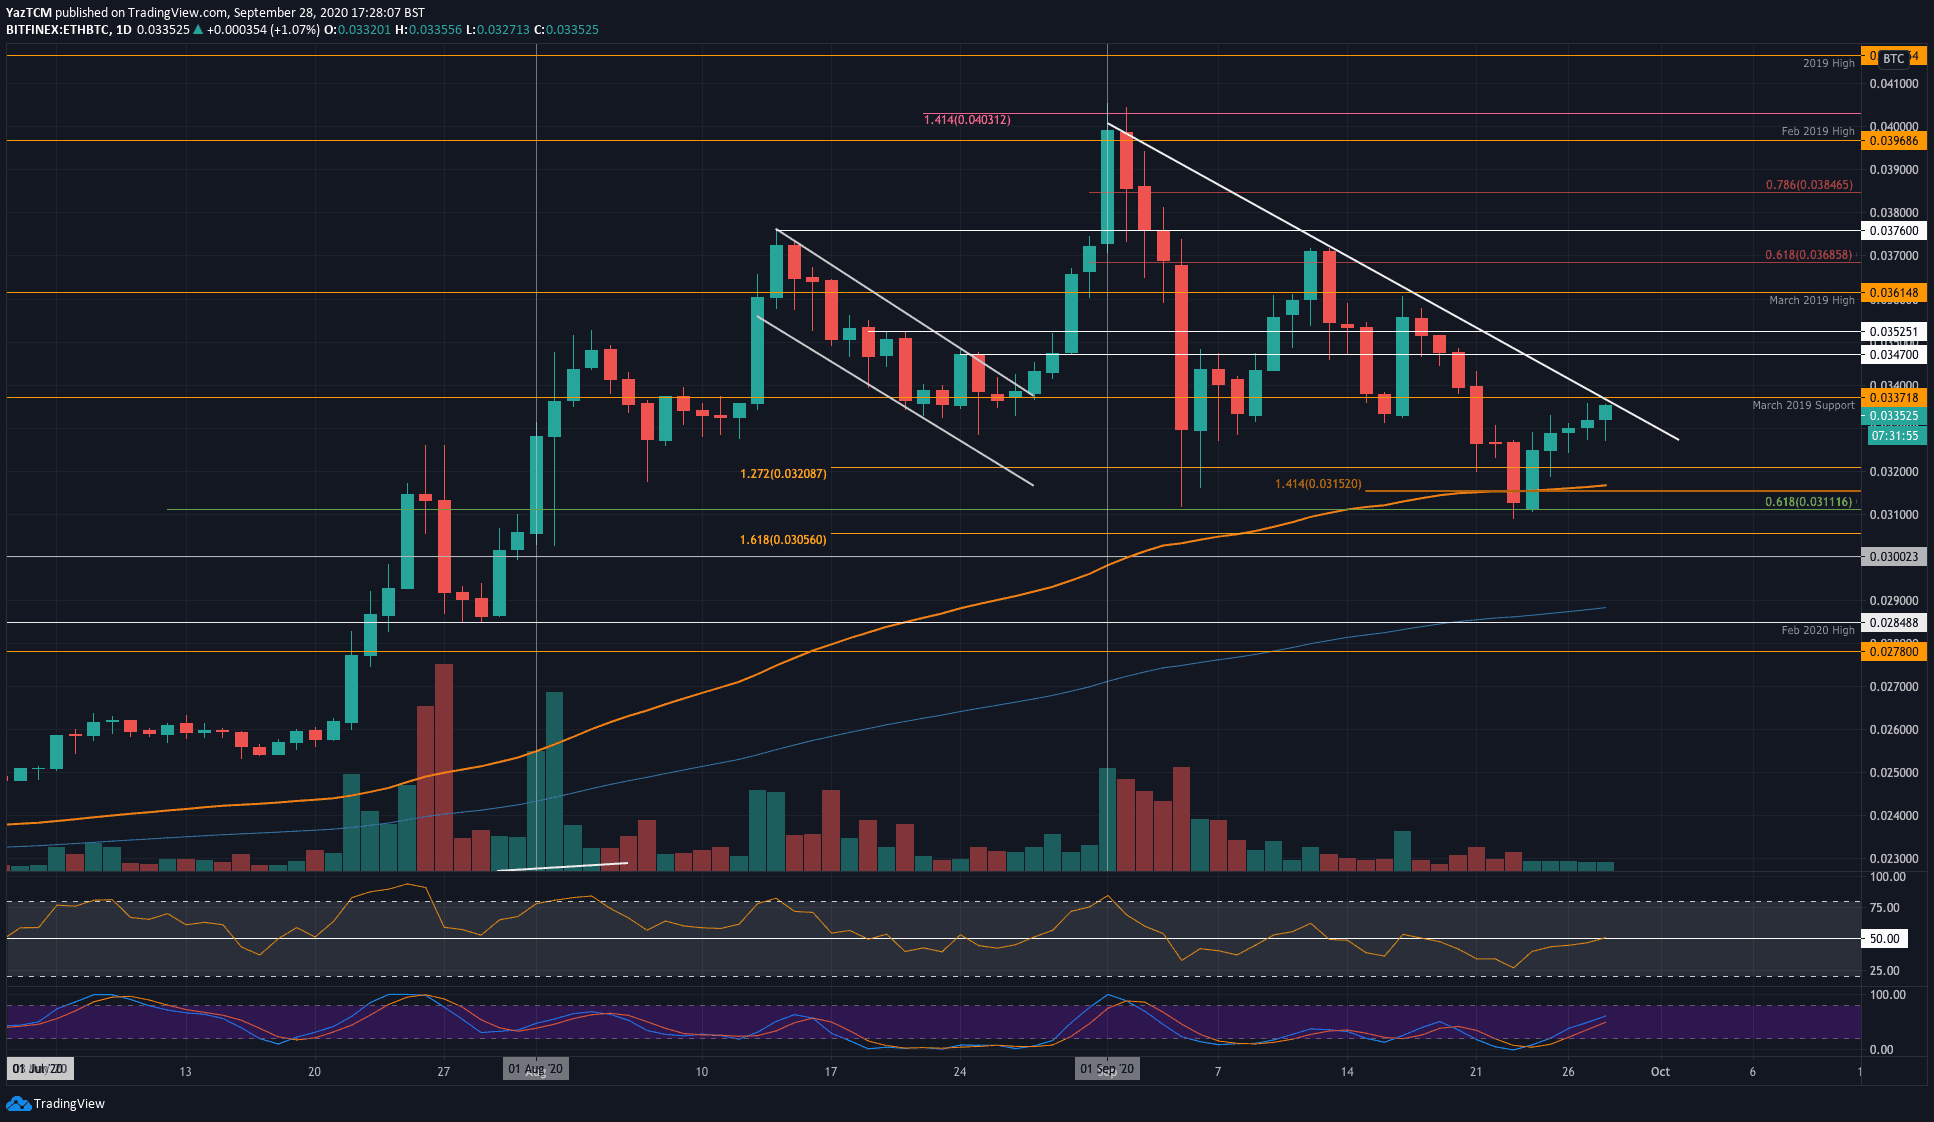
Ethereum also rebounded at the 0.0311 BTC level (.618 Fib Retracement) over last week against Bitcoin. From there, it pushed higher over the weekend but has recently run into resistance at a falling trend line, which has dictated the market since the start of September.
This resistance area is further bolstered by the March 2019 support (now resistance) and will require significant momentum to break today.
ETH-BTC Short Term Price Prediction
Looking ahead, if the buyers can break the falling trend line, the first level of higher resistance lies at 0.034 BTC. Following this, resistance lies at 0.0347 BTC, 0.0352 BTC, and 0.0361 BTC (March 2019 highs).
On the other side, the first level of support lies at 0.033 BTC. Beneath this, support is located at 0.032 BTC, 0.0315 BTC (100-days EMA), and 0.0311 BTC (.618 Fib Retracement).
Click here to start trading on BitMEX and receive 10% discount on fees for 6 months.
Disclaimer: Information found on CryptoPotato is those of writers quoted. It does not represent the opinions of CryptoPotato on whether to buy, sell, or hold any investments. You are advised to conduct your own research before making any investment decisions. Use provided information at your own risk. See Disclaimer for more information.
The post appeared first on CryptoPotato


 Options Markets: Kaiko")
