
ETH/USD – Ethereum Rebounds At Trend Line Support
Key Support Levels:$438, $430, $421.
Key Resistance Levels: $445, $462, $475.
Ethereum saw a strong 9.4% price surge today, which allowed the coin to break past resistance at $416 (bearish .618 Fib) and climb above $430 to reach the current $441 price. The coin is now testing resistance at 3-month highs around the $445 level – provided by a bearish .786 Fib Retracement.
This latest surge is primarily driven by Bitcoin scratching $16,000. However, it was also helped by the fact that Ethereum managed to reverse against Bitcoin finally.
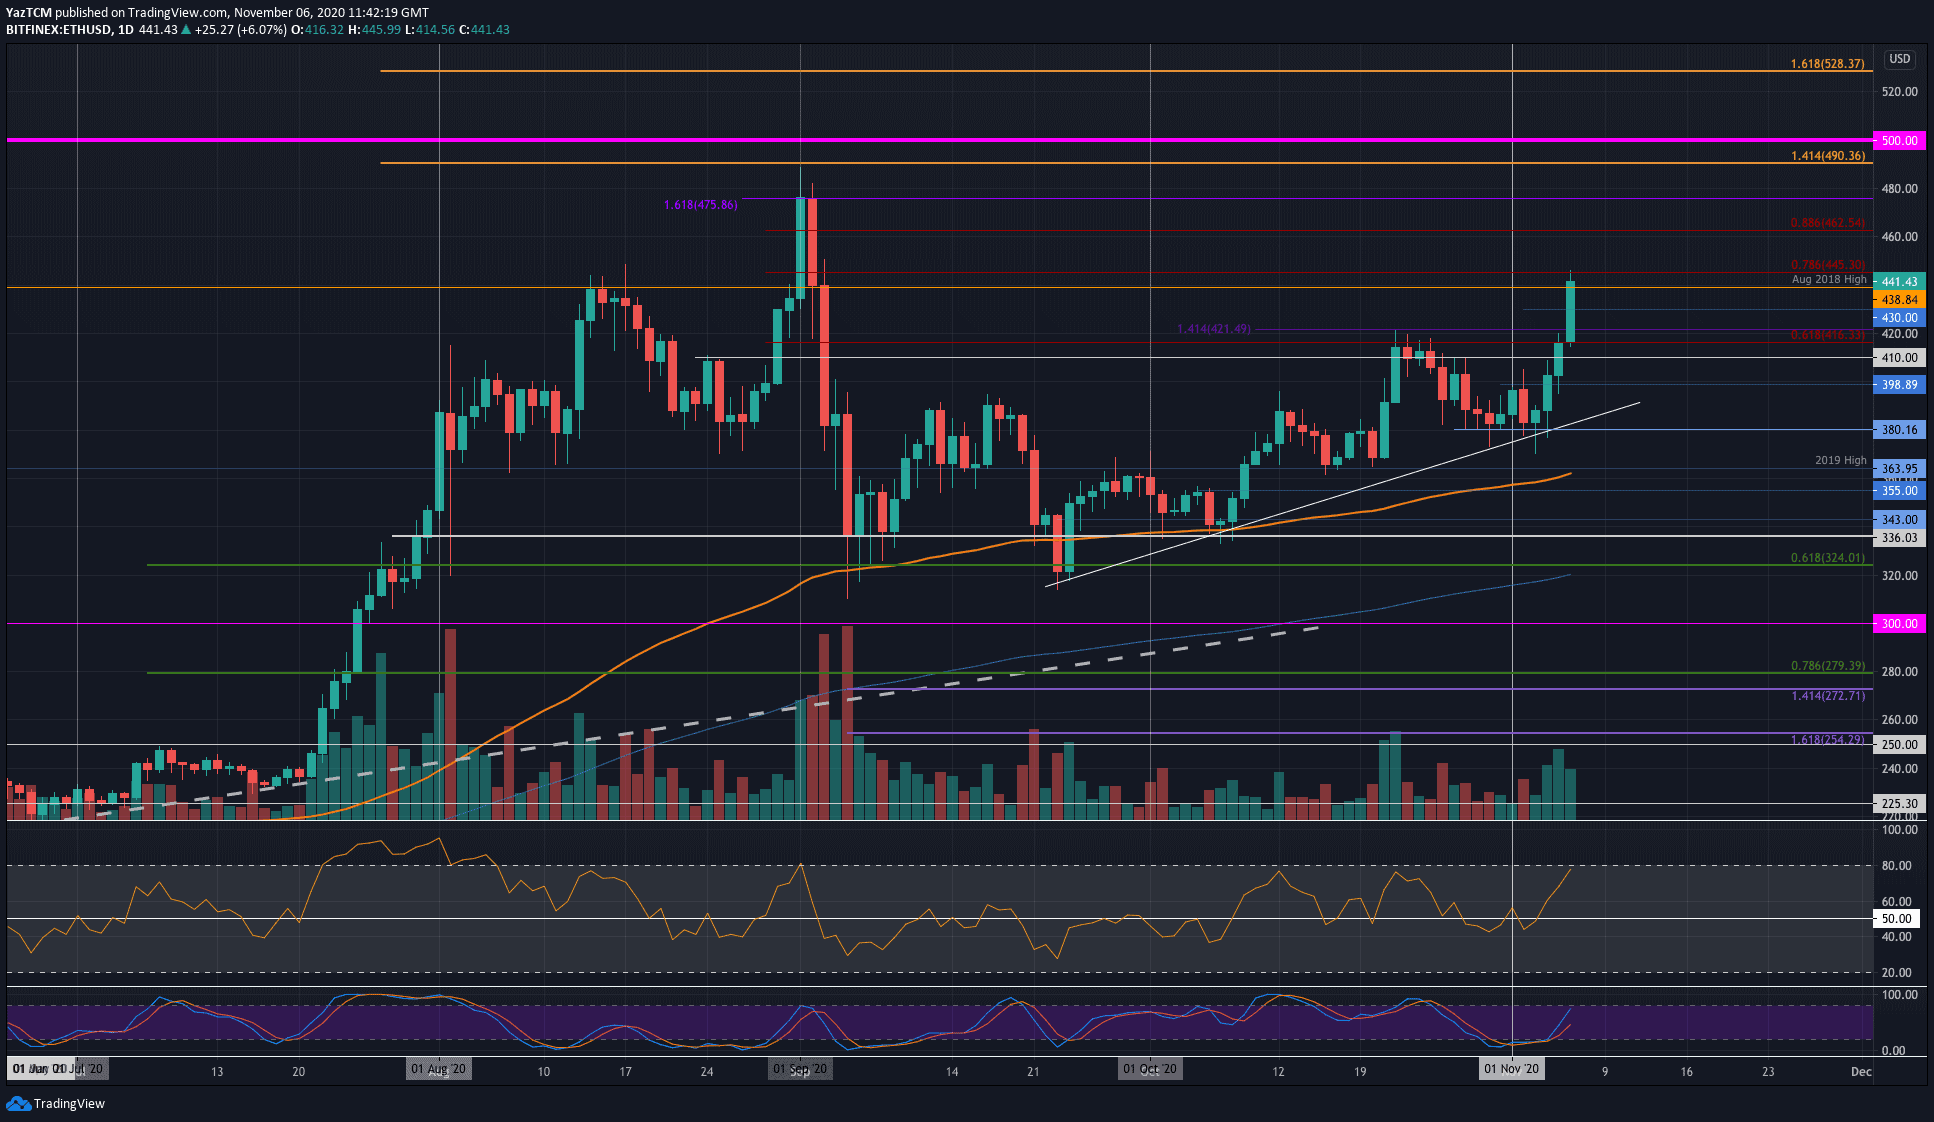
ETH-USD Short Term Price Prediction
Looking ahead, the first level of resistance lies at $445 (bearish .76 Fib). Above this, resistance is expected at $462 (bearish .886 Fib), $475 (September high-day closing price), and $490. Beyond $490, resistance lies at $500 and $510.
On the other side, the first level of support lies at $438 (August 2018 Highs). Beneath this, support lies at $430, $421, and $416.
The Stochastic RSI recently produced a bullish crossover signal that helped the market move higher.
ETH/BTC – Bulls Finally Rebound To End Ethereum Turmoil
Key Support Levels: 0.0278 BTC, 0.0267 BTC, 0.0262 BTC
Key Resistance Levels: 0.0294 BTC, 0.029 BTC, 0.0296 BTC.
Against Bitcoin, Ethereum had been in an extended downtrend since September. The coin dropped further lower in November until support was found yesterday at 0.0267 BTC (Downside 1.272 Fib Extension).
Ethereum managed to rebound from this support today as they pushed higher into the 0.0284 BTC resistance (Feb 2020 High). It would need to continue further above 0.029 BTC to confirm a solid reversal against BTC.

ETH-BTC Short Term Price Prediction
Looking ahead, if the bulls break 0.0294 BTC, the first level of resistance lies at 0.029 BTC. Above this, resistance lies at 0.0296 BTC (200-days EMA) and 0.03 BTC. Additional resistance can be found at 0.0305 BTC and 0.0311 BTC (100-days EMA).
On the other side, the first level of support lies at 0.0278 BTC. Following this, support is located at 0.0267 BTC (downside 1.272 Fib Extension), 0.0262 BTC, and 0.0253 BTC.
The RSI has rebounded from oversold conditions and has approached the mid-line suggesting that the previous bearish momentum has totally faded. Additionally, the Stochastic RSI produced a bullish crossover signal, which is a promising sign.
Binance Futures 50 USDT FREE Voucher: Use this link to register & get 10% off fees and 50 USDT when trading 500 USDT (limited offer).
Disclaimer: Information found on CryptoPotato is those of writers quoted. It does not represent the opinions of CryptoPotato on whether to buy, sell, or hold any investments. You are advised to conduct your own research before making any investment decisions. Use provided information at your own risk. See Disclaimer for more information.
The post appeared first on CryptoPotato


