
ETH/USD – Bulls Defending .382 Fib Retracement
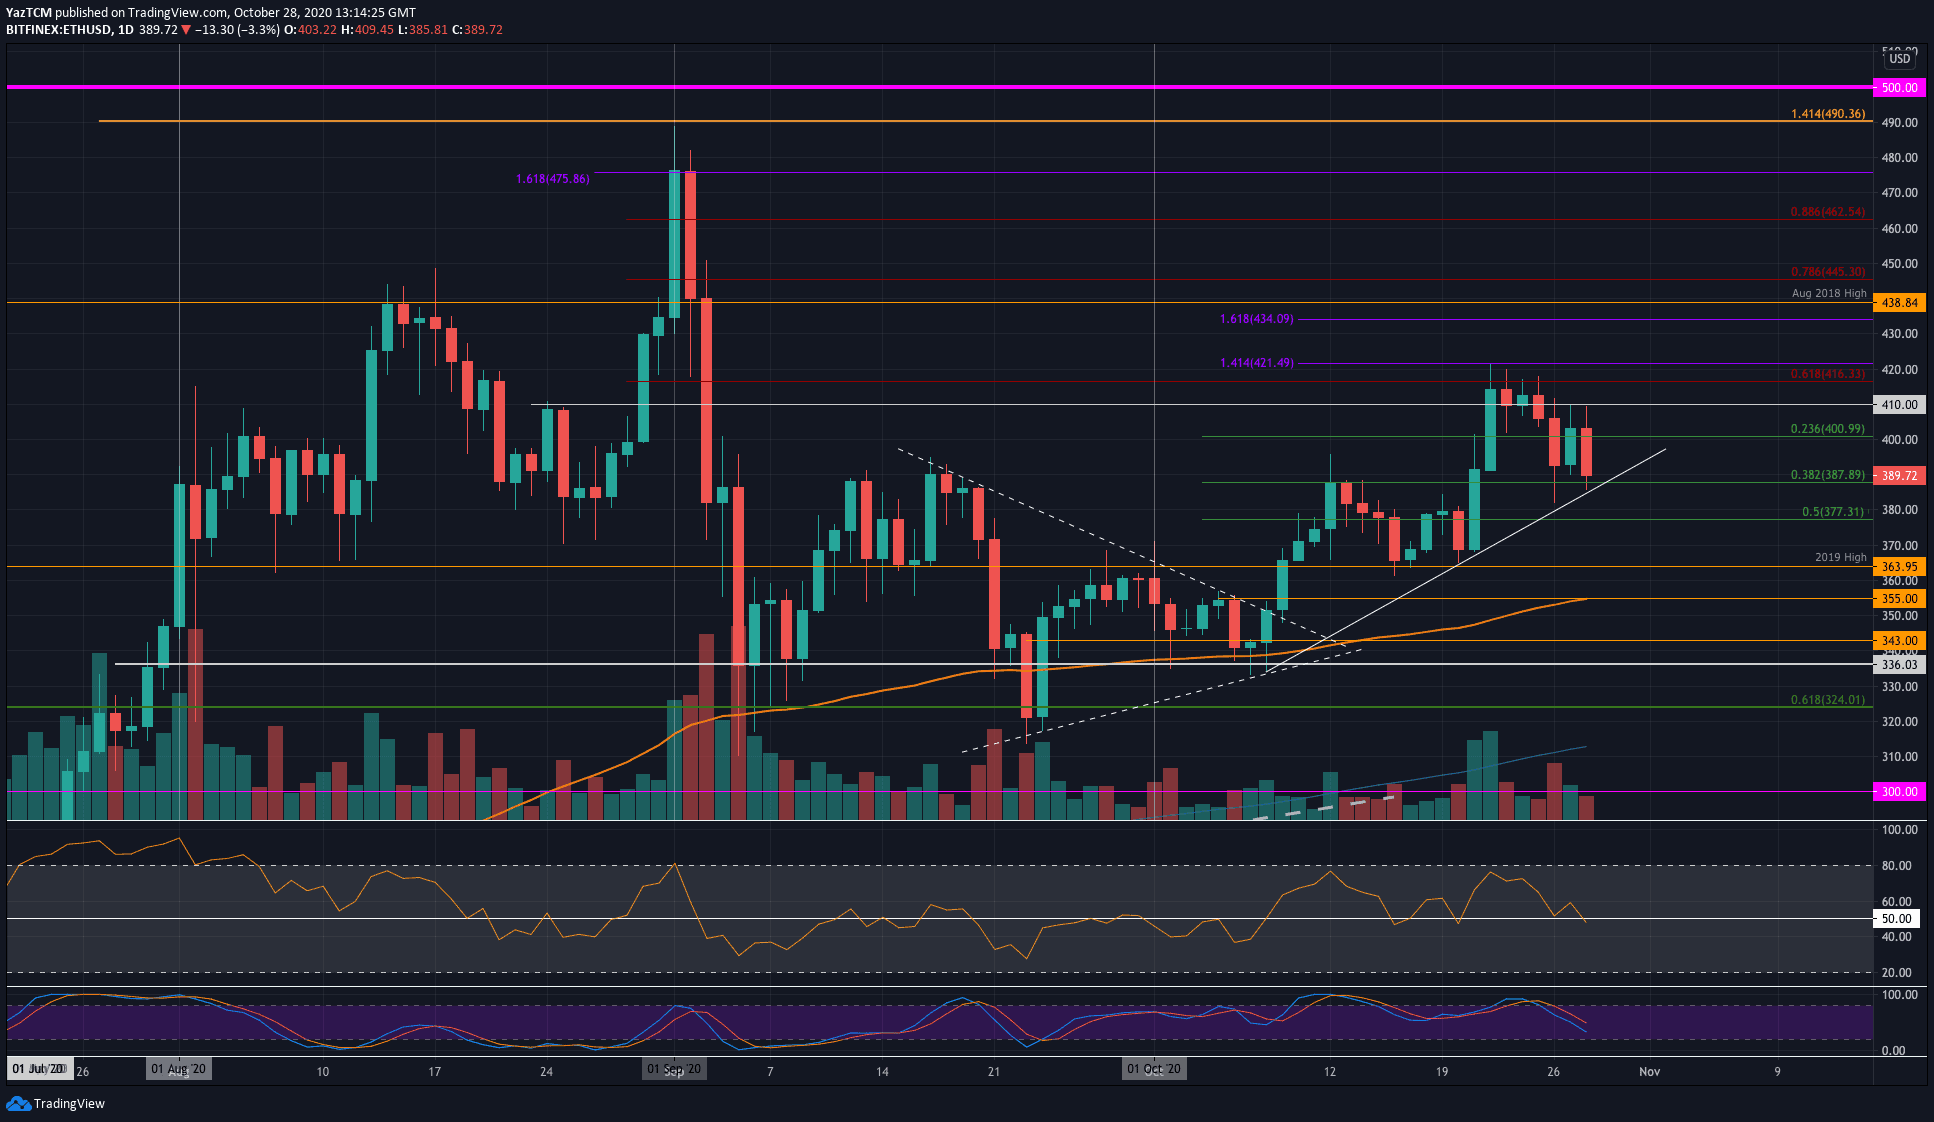
Key Support Levels: $377, $370, $364.
Key Resistance Levels: $400, $410, $416.
Toward the end of last week, Ethereum surged higher from $370 as it climbed above the $400 level and managed to reach as high as $421 (1.414 Fib Extension). More specifically, it was unable to close a daily candle above the $416 resistance (bearish .618 Fib Retracement) throughout the weekend which caused it to drop beneath $400 on Monday.
Yesterday, the buyers did attempt to recover as they spiked into the $410 resistance. However, the sellers returned today to push ETH into the $389 support (.382 Fib Retracement). The support here is further bolstered by Octobers’ rising trend line.
ETH-USD Short Term Price Prediction
Looking ahead, if the sellers break beneath $389 and push below the rising trend line, the first level of support lies at $377 (.5 Fib Retracement). Following this, support is found at $370, $364 (2019 High), and $355 (100-days EMA).
On the other side, the first level of resistance lies at $400. This is followed by $410, $416 (bearish .618 Fib), and $421 (1.414 Fib Extension).
The RSI has returned to the mid-line to indicate indecision within the market. If it dips further beneath the mid-line, the sellers will gain control of the market momentum and will likely push ETH beneath the current trend line.
ETH/BTC – Sellers Push Coin To 3-Month Lows
Key Support Levels: 0.0288 BTC, 0.0284 BTC, 0.0281 BTC.
Key Resistance Levels: 0.03 BTC, 0.0305 BTC, 0.0311 BTC.
Against Bitcoin, Ethereum has struggled heavily in October as it reached a 3-month low today. Earlier in the month, ETH fell beneath a symmetrical triangle which was the first sign that there was some downward pressure ahead.
This week, ETH dropped beneath the 0.03 BTC level a couple of days ago. Yesterday, ETH continued lower as it fell beneath the 200-days EMA to reach the current 0.0292 BTC support today.

ETH-BTC Short Term Price Prediction
Looking ahead, if the sellers continue to drive lower, the first level of support lies at 0.0288 BTC. This is followed by support at 0.0284 BTC (Feb 2020 High), 0.0281 BTC, and 0.0278 BTC.
On the other side, the first level of resistance lies at 0.03 BTC. Above this, resistance is expected at 0.0305 BTC, 0.0311 BTC, and 0.032 BTC (100-days EMA).
Both the RSI and Stochastic RSI are in extremely oversold territory which shows the sellers might be a little overextended.
Binance Futures 50 USDT FREE Voucher: Use this link to register & get 10% off fees and 50 USDT when trading 500 USDT (limited offer).
Disclaimer: Information found on CryptoPotato is those of writers quoted. It does not represent the opinions of CryptoPotato on whether to buy, sell, or hold any investments. You are advised to conduct your own research before making any investment decisions. Use provided information at your own risk. See Disclaimer for more information.
The post appeared first on CryptoPotato


