
ETH/USD – Bulls Defend Support at 2019 Highs
Key Support Levels: $364, $355, $346.
Key Resistance Levels: $380, $396, $400.
Last week, Etheruem had surged as high as $396 as it hit the resistance provided by a bearish .5 Fib Retracement level. Over the week, Ethereum started to head lower from here as it broke beneath $376 to reach the support at the 2019 High at $364 on Friday.
ETH bounced higher over the weekend as it reached as high as $380. However, the coin is now facing short term resistance at a falling trend line and must overcome this level to continue higher toward $400.
It’s worth noting that the cryptocurrency is trapped in a range and it’s unable to break from it for the time being.

ETH-USD Short Term Price Prediction
Looking ahead, if the buyers manage to break the trend line and head above $380, the first level of resistance lies at $396 (bearish .5 Fib). This is closely followed by resistance at $400. Beyond $400, additional resistance lies at $410 and $416 (bearish .618 Fib).
On the other side, if the sellers push beneath $375, the first level of support lies at $364 (2019 Highs). Beneath this, support lies at $355, $346 (100-days EMA), and $336.
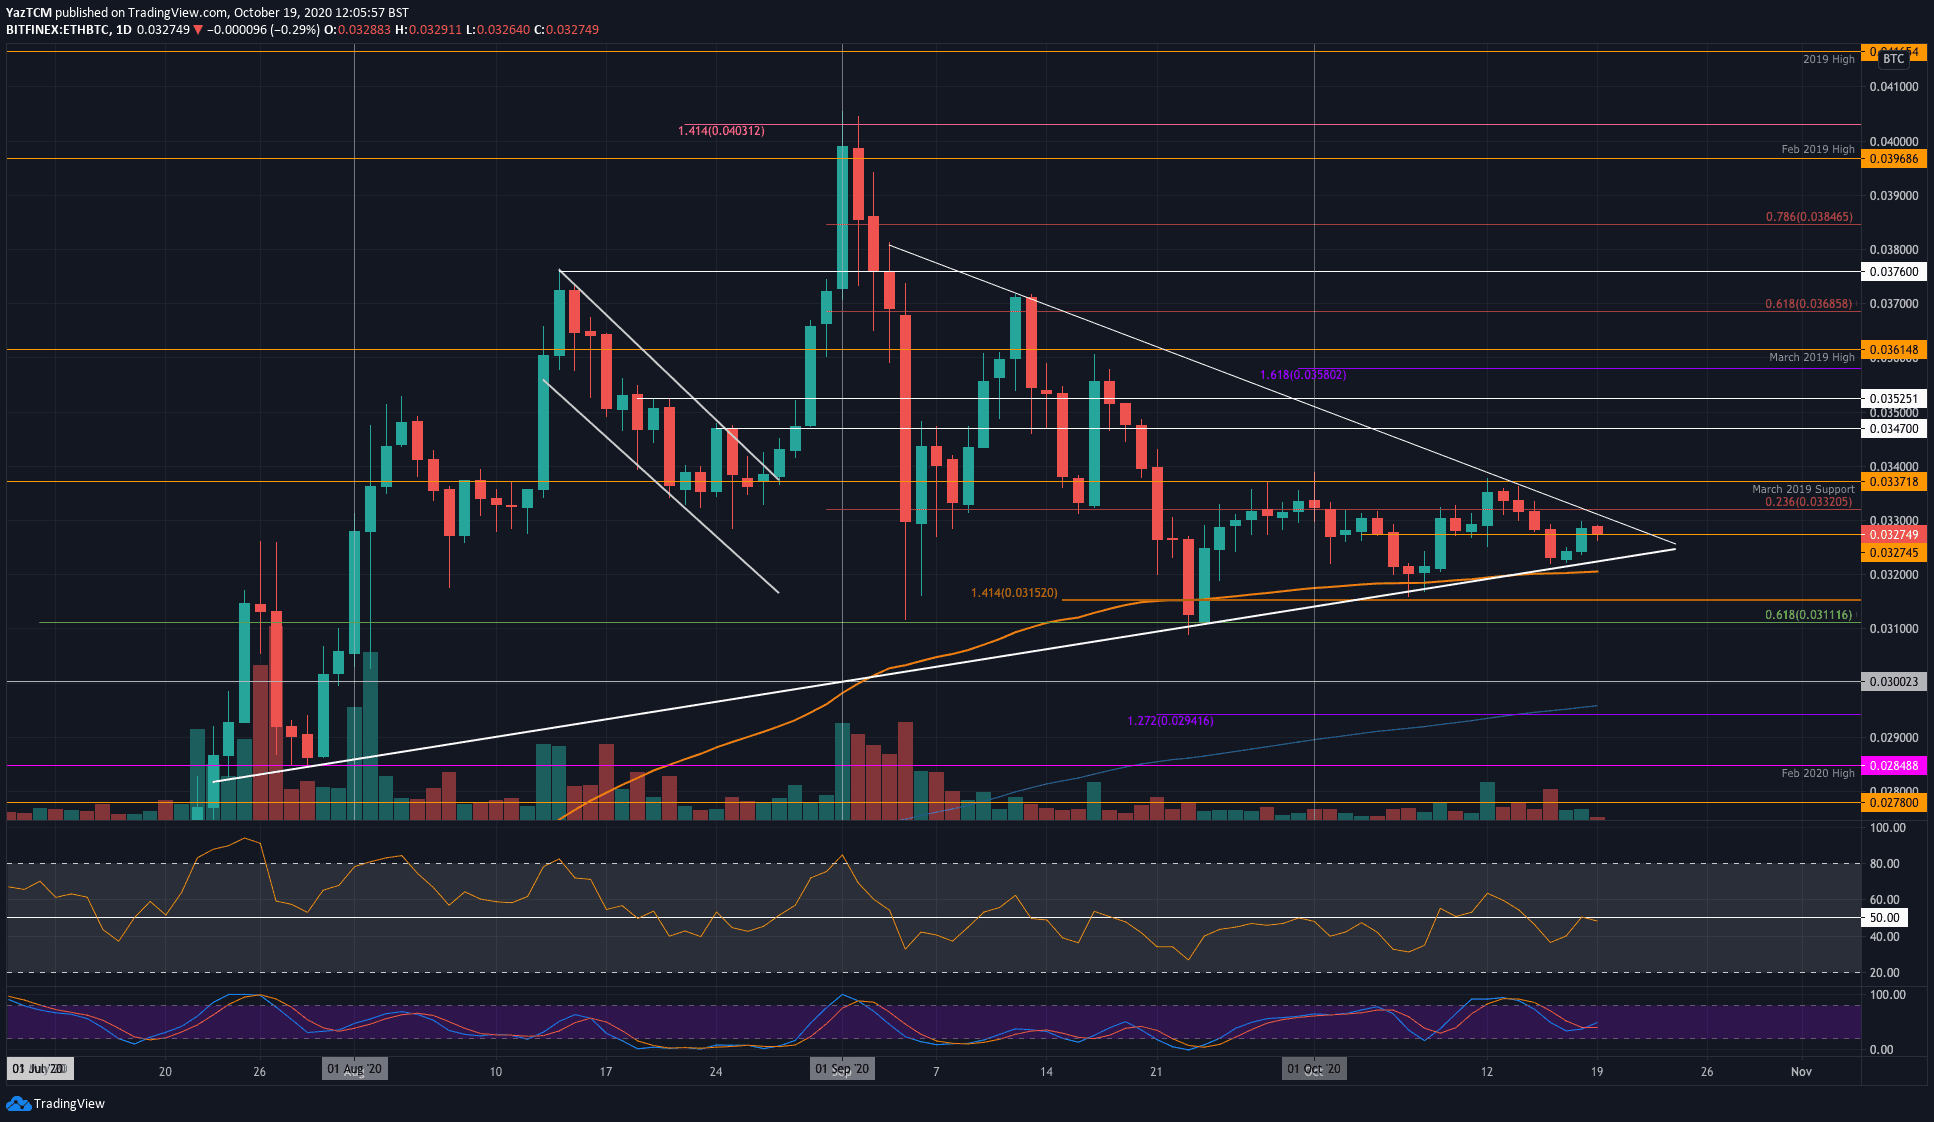
ETH/BTC – ETH Trading Inside Consolidation Pattern.
Key Support Levels: 0.032 BTC, 0.0315 BTC, 0.0311 BTC.
Key Resistance Levels: 0.0337 BTC, 0.034 BTC, 0.0347 BTC.
Against Bitcoin, Ethereum is currently trading within a symmetrical triangle pattern that started in the first week of September. Each time the bulls attempt to push above the triangle, they are rejected by the upper boundary and head lower.
Last week, they tried to push above 0.0337 BTC (March 2019 Support – now resistance) but failed to follow through. As a result, they headed into the lower boundary, where the market rebounded over the weekend to reach the current 0.0327 BTC level.
ETH-BTC Short Term Price Prediction
Looking ahead, if the buyers can break the upper boundary, the first level of resistance lies at 0.0337 BTC. Above this, resistance is expected at 0.034 BTC, 0.0347 BTC, and 0.0352 BTC.
On the other side, the first level of support lies at the lower boundary of the triangle. Beneath this, support lies at 0.032 BTC (100-days EMA), 0.0315 BTC, and 0.0311 BTC (.618 Fib Retracement).
The RSI is at the mid-line, which shows the market is in a state of indecision. For a break above the triangle, the RSI must break the mid-line to show bullish momentum within the market.
Binance Futures 50 USDT FREE Voucher: Use this link to register & get 10% off fees and 50 USDT when trading 500 USDT (limited offer).
Disclaimer: Information found on CryptoPotato is those of writers quoted. It does not represent the opinions of CryptoPotato on whether to buy, sell, or hold any investments. You are advised to conduct your own research before making any investment decisions. Use provided information at your own risk. See Disclaimer for more information.
The post appeared first on CryptoPotato


