
Other than the bullish movement earlier this year, where ETH reached its 2019 high at around $360, the coin spent most of the year under the $220 mark. The recent Ethereum Istanbul upgrade also didn’t do ETH any favors, dropping to a value of $128 at the time of writing.
Ethereum 1-day chart
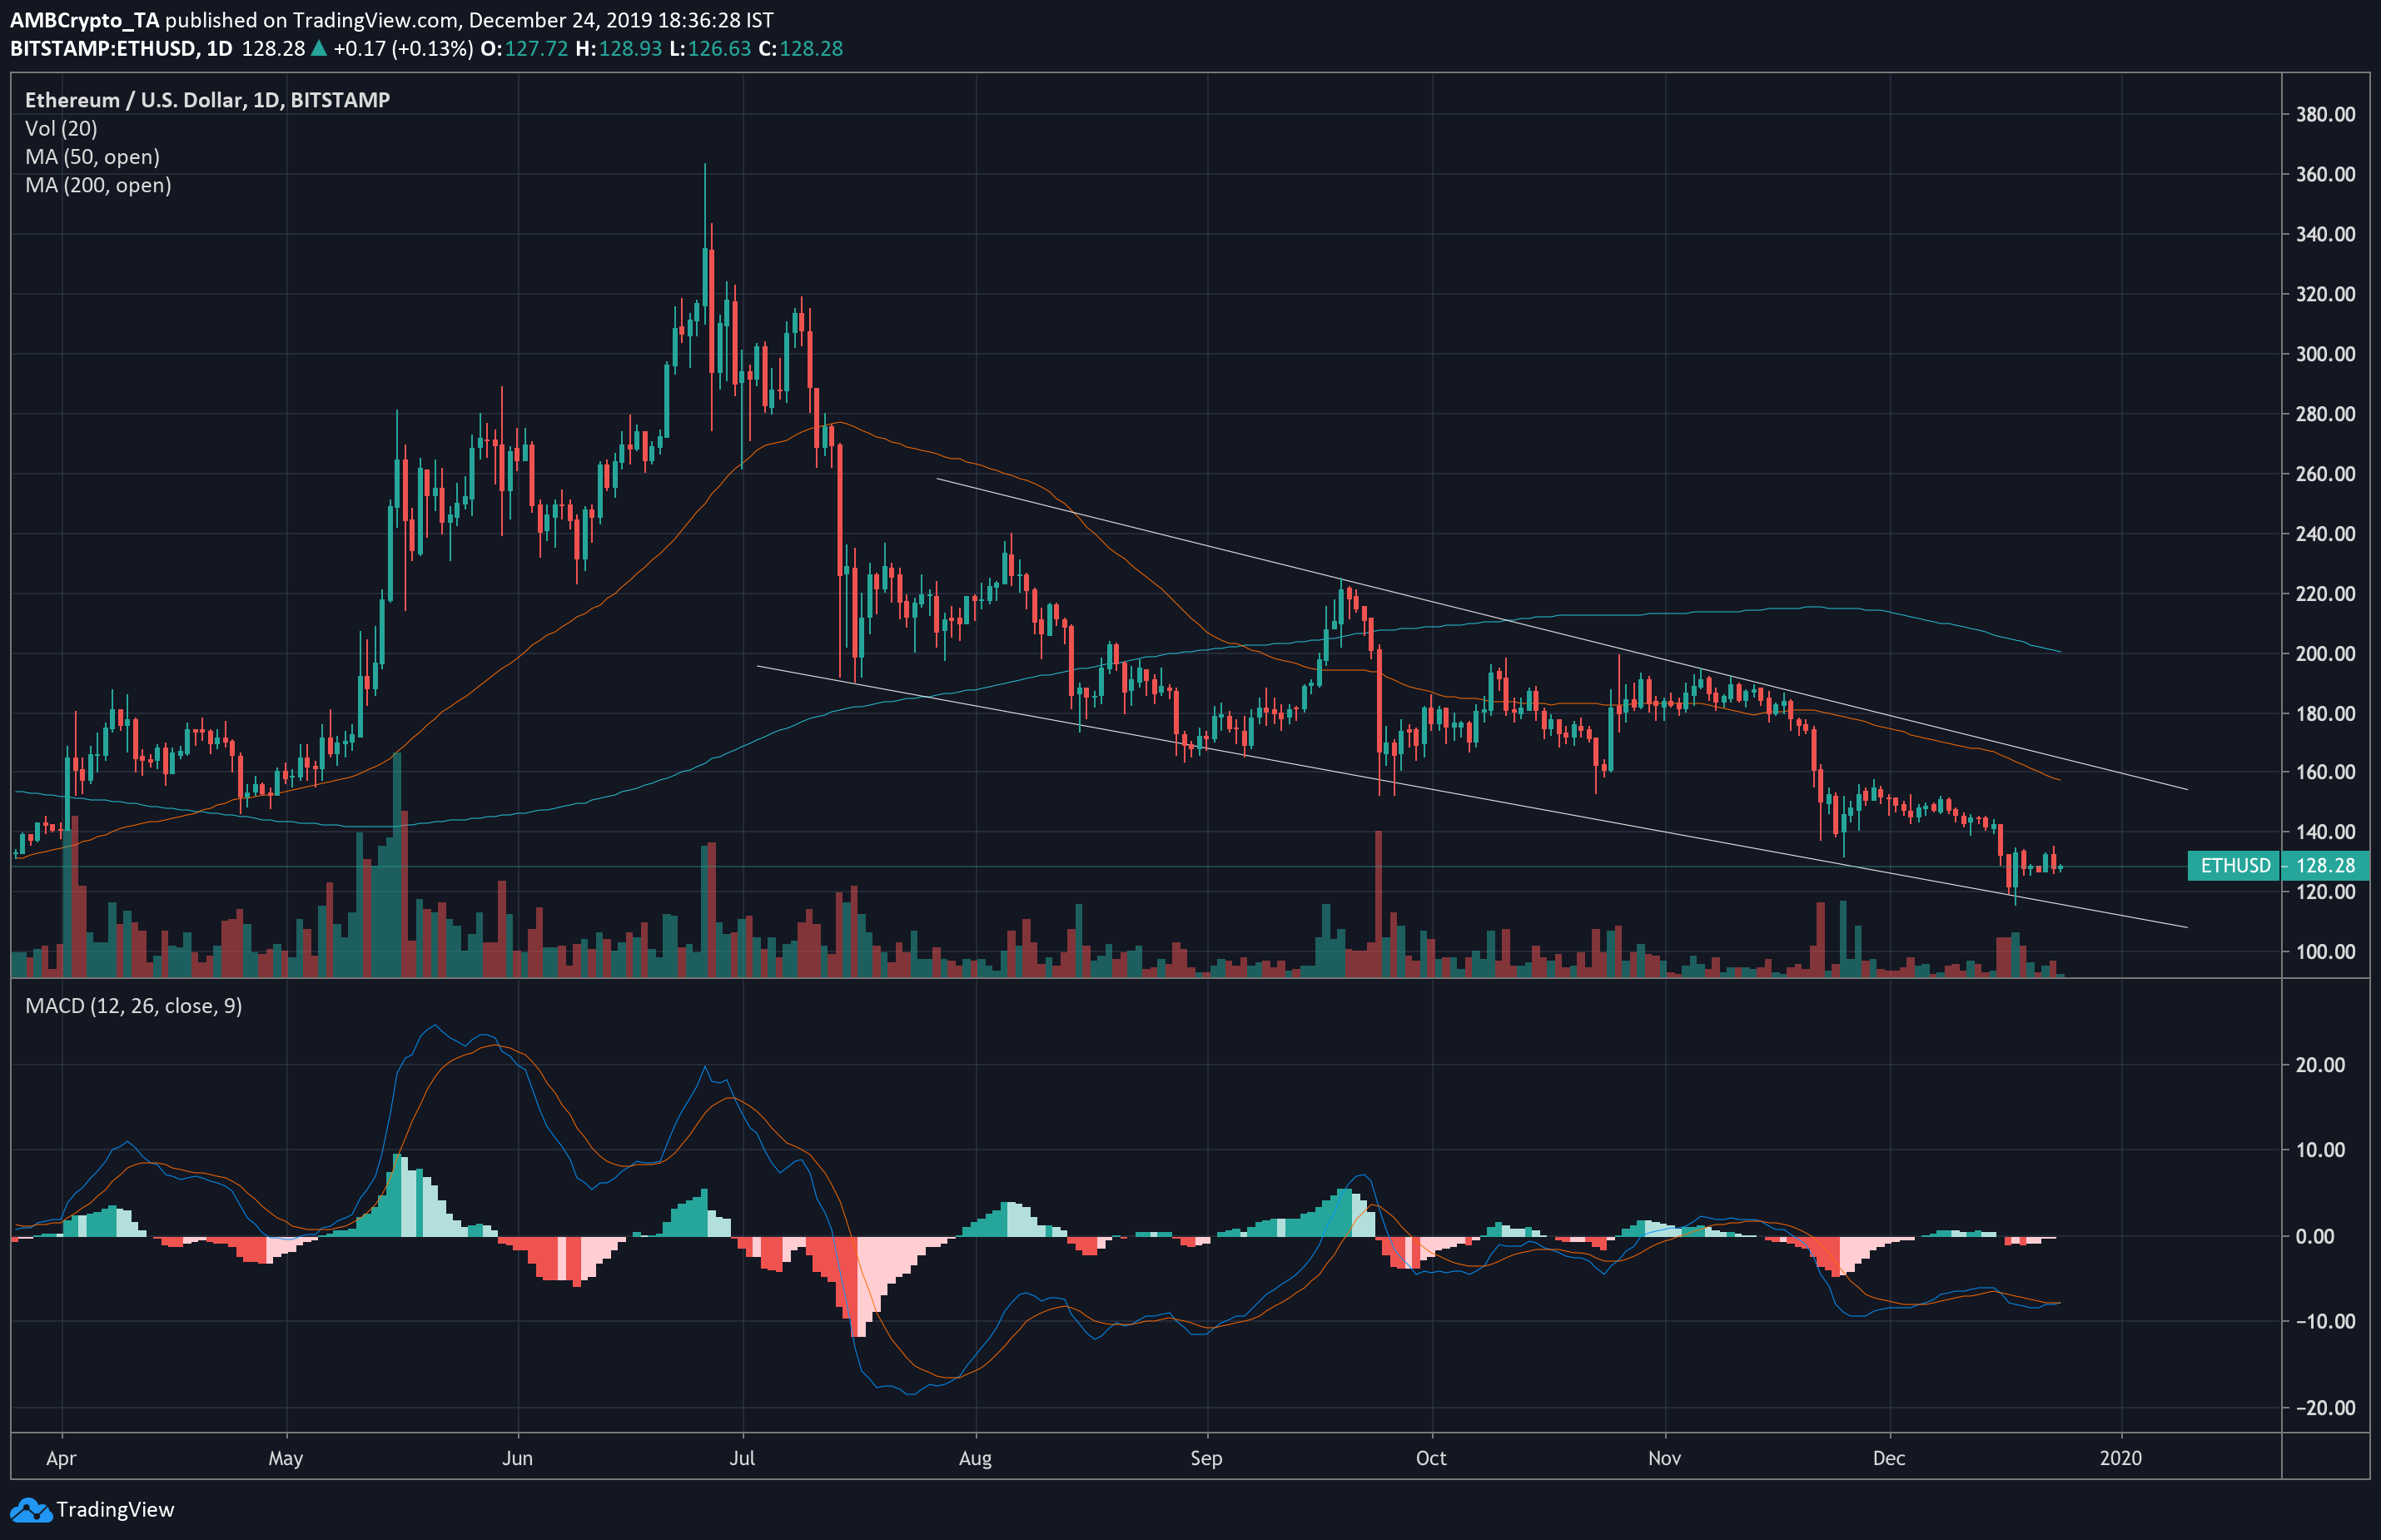
Source: ETHUSD on TradingView
The daily chart showed that ETH had entered a falling wedge pattern in mid-July, accompanied by a decreasing volume trend over the period. These patterns breakout upward in 68% of cases, lending a higher probability to a short-term rise in ETH value.
Also, the price could be making a move toward the 50 and 200-day moving averages, further bearing the possibility of a bullish move.
Fibonacci retracement levels
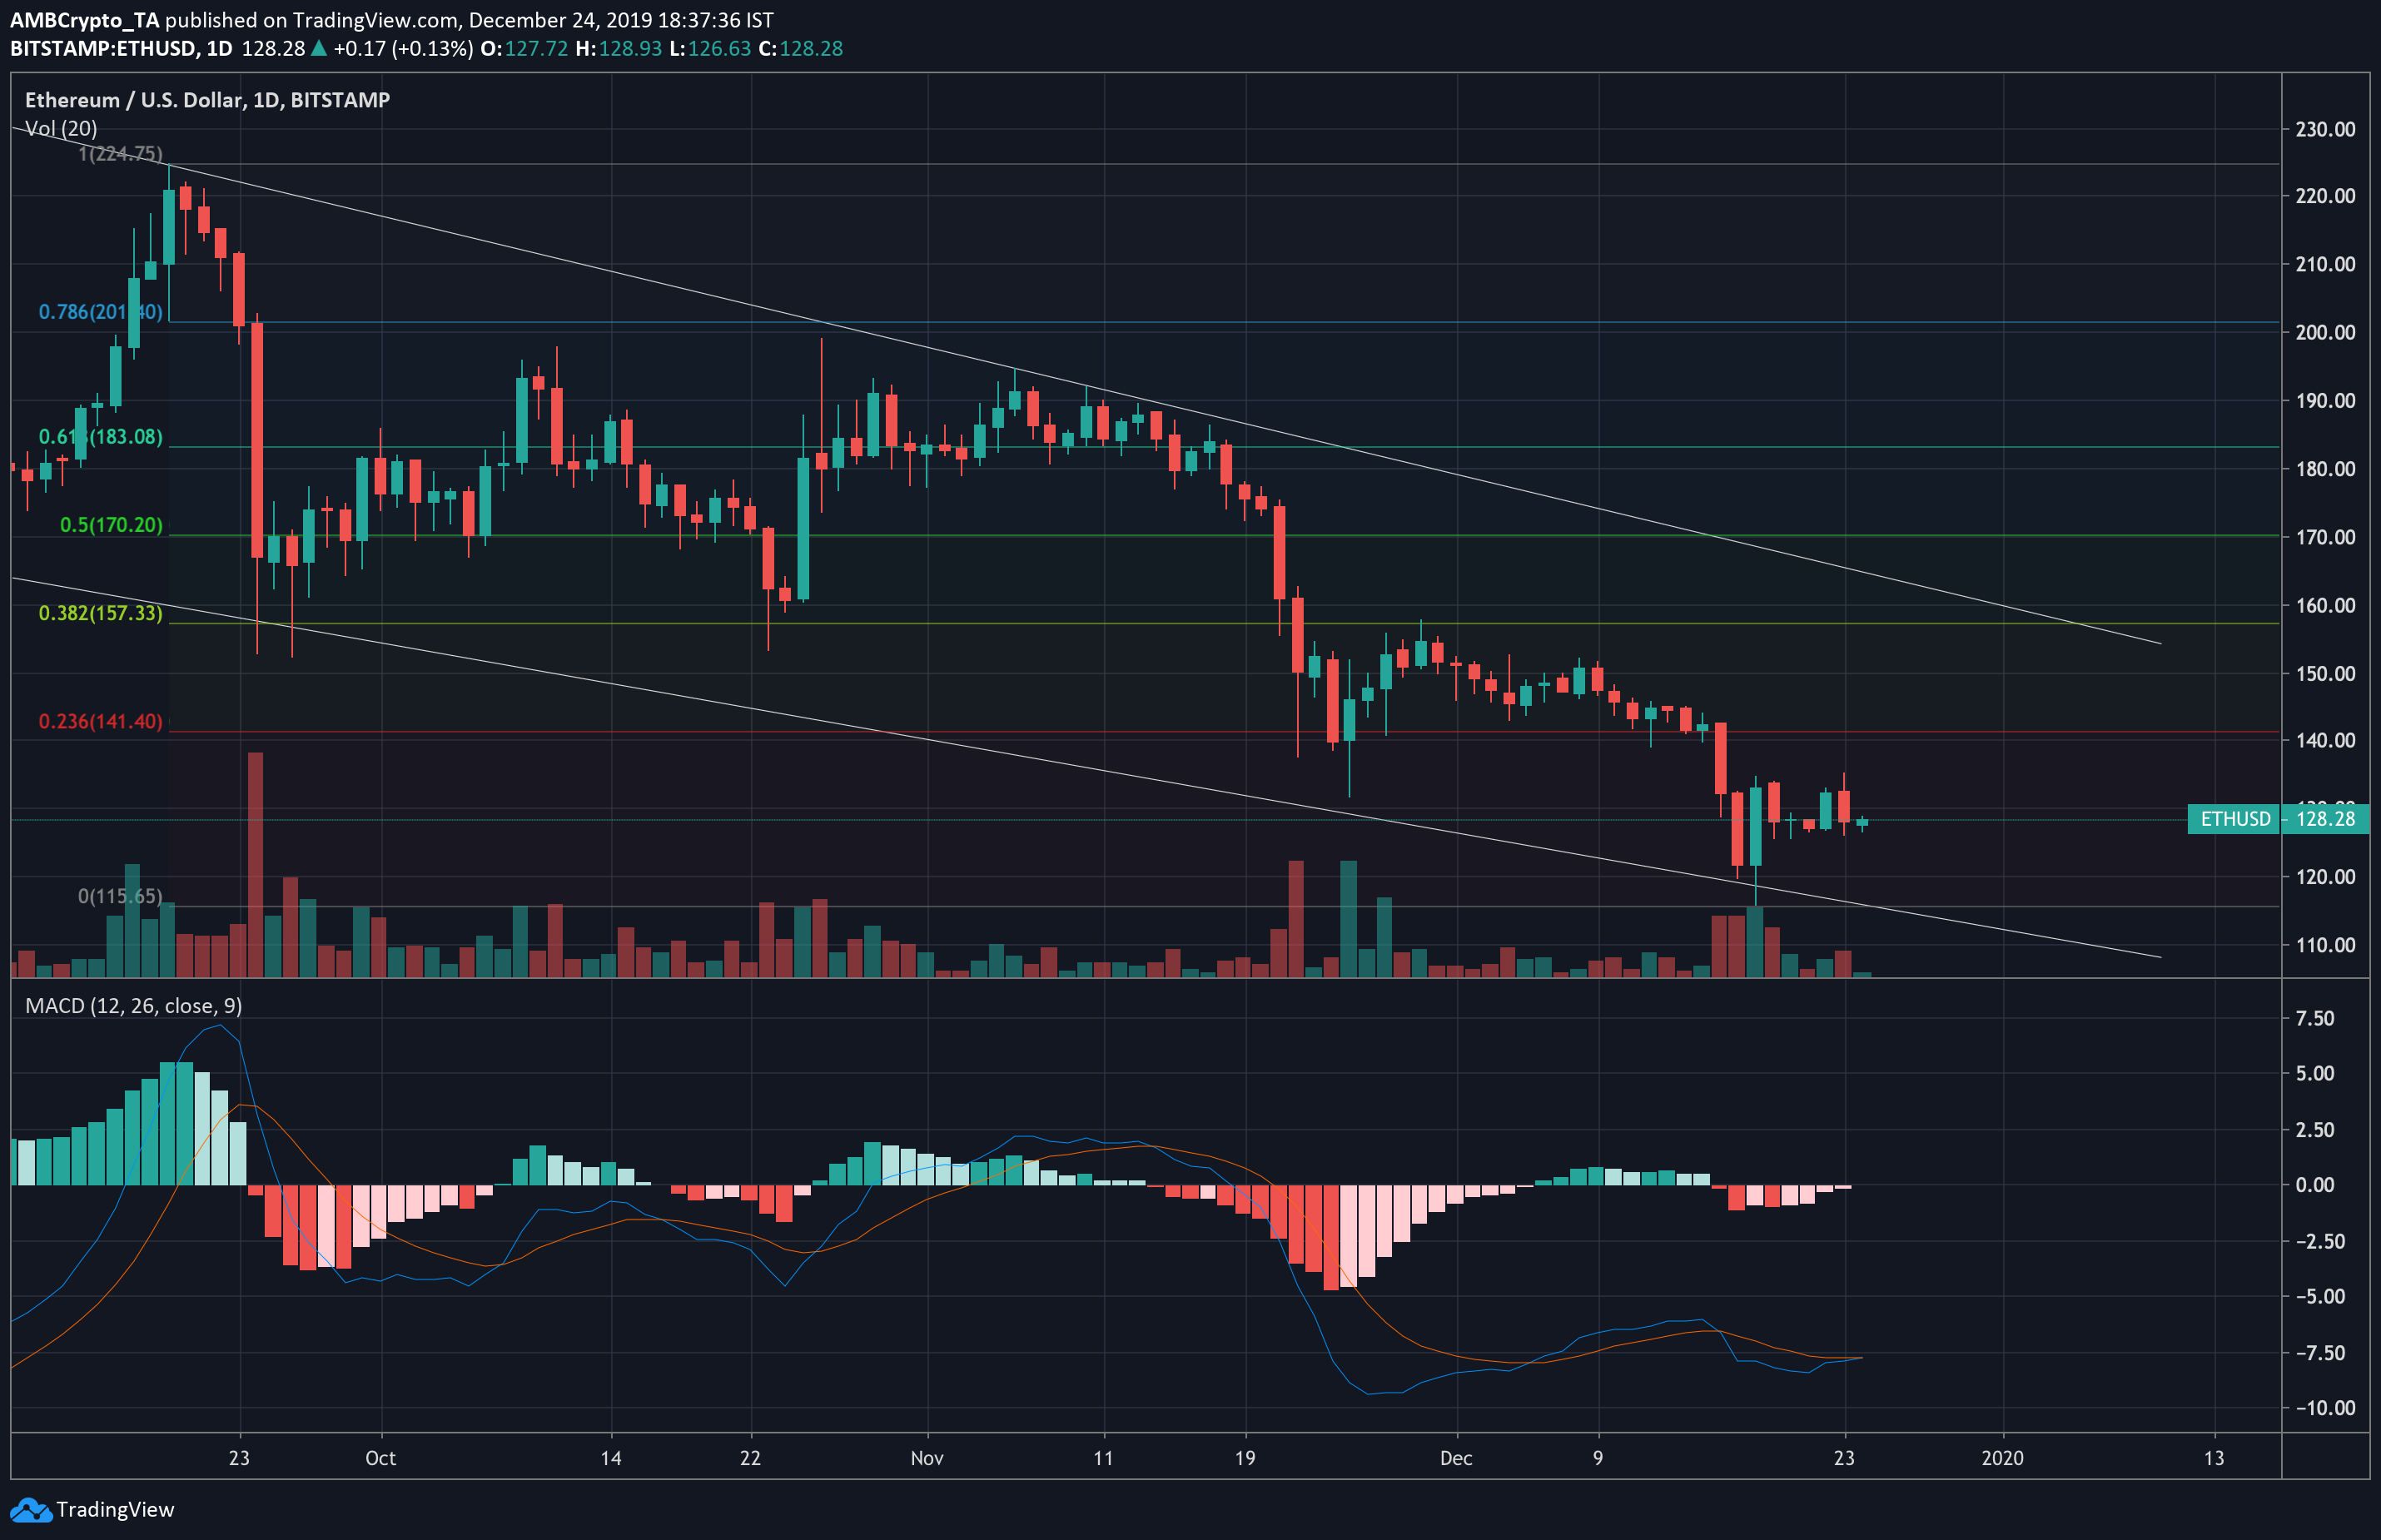
Source: ETHUSD on TradingView
Since breaching the 23.6% Fibonacci retracement line a little over a week ago, ETH has been consolidating between $120 and $130. With MACD poised for a bullish crossover, a move upward seems likely and would see the coin testing the same line once again in the next few days. This could set the stage for a push to $160 over the following week, positioning itself for an upward breakout in January.
TD Sequential & Stochastic RSI
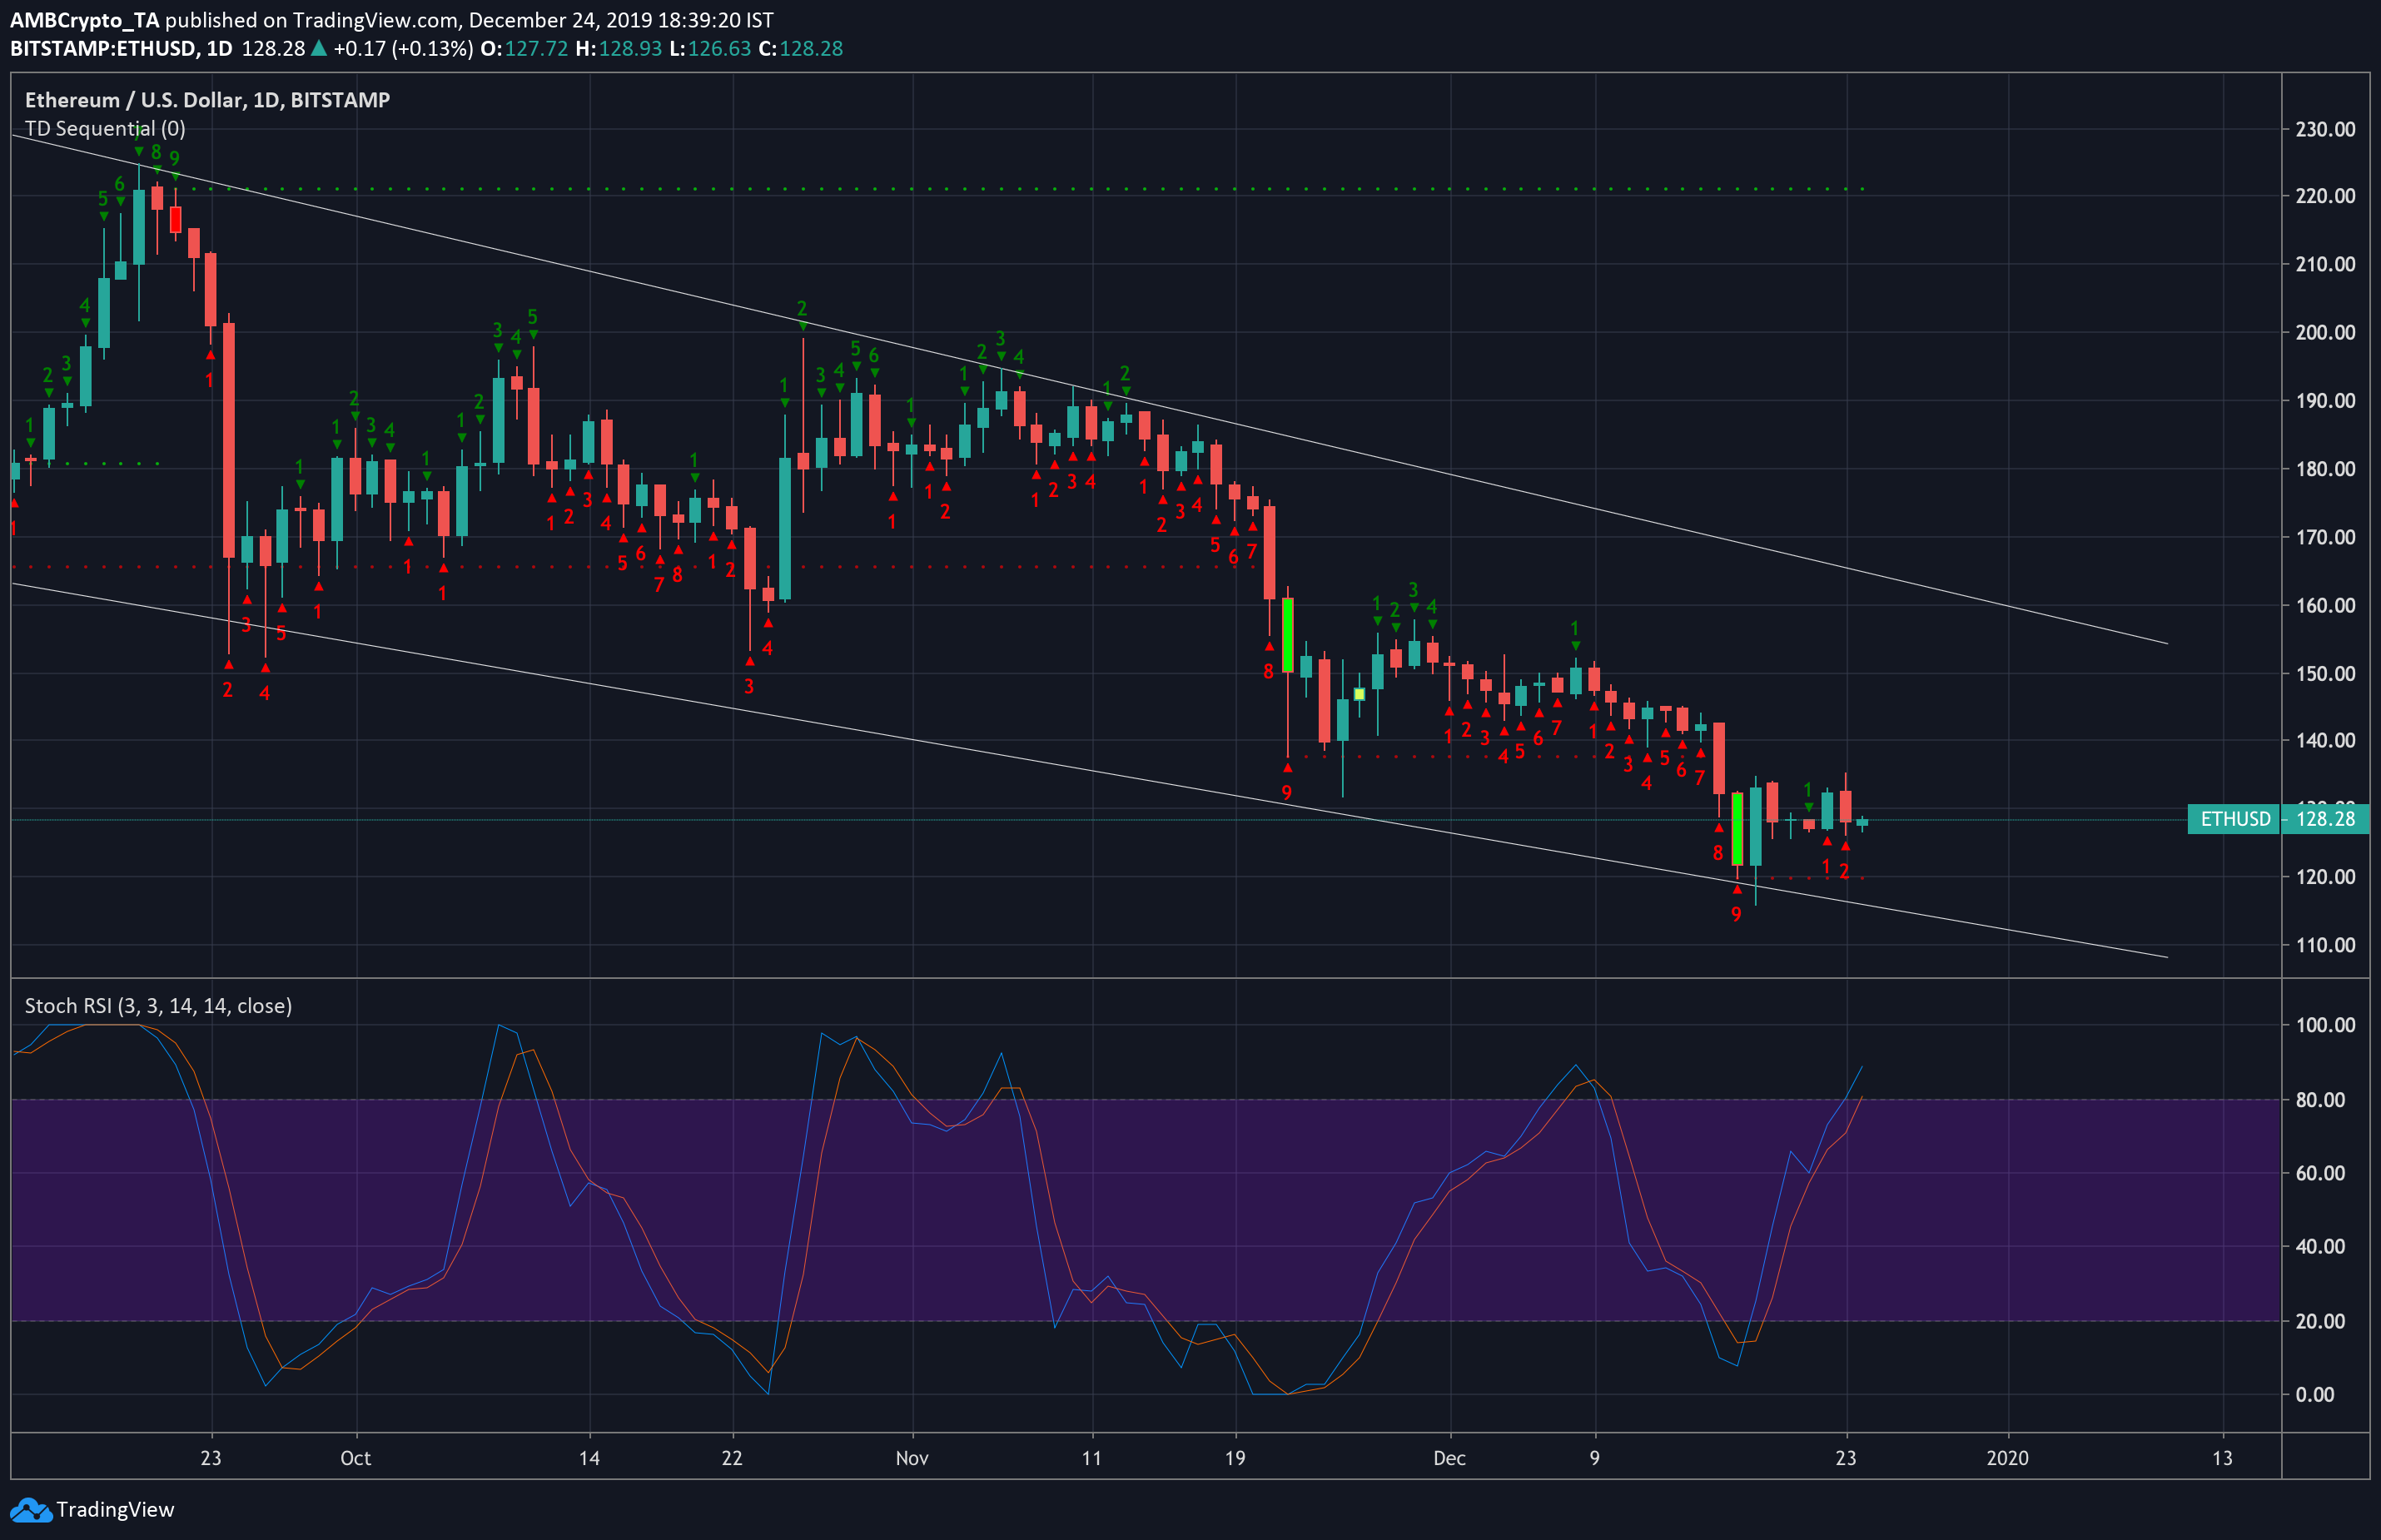
Source: ETHUSD on TradingView
The TD sequential indicator can be helpful in marking buy and sell areas by comparing closing values with that of the candle 4 days prior. If the candles consecutively close lower for 9 days, this can be a strong signal to buy.
The chart above showed the TDS indicator reporting a buy-signal just over a week ago, and though the countdown, which should follow, has not been completed, this could mean that a large rise in value could be in store for the Ethereum coin.
Despite Stochastic RSI moving in the overbought zone, a continual residence in this area can be a signal of the pump to come, with an upward breakout possibly seeing ETH jump to $240 by mid-January. Failing this, the price will likely move sideways, with a slight negative slope.
The post appeared first on AMBCrypto


