
Ethereum is approaching the main $152 and $155 resistance levels against the US Dollar.The price is likely to rally significantly once there is a clear break above $152.There is a key bullish trend line forming with support near $148 on the hourly chart of ETH/USD (data feed via Kraken).The price could dip a few points, but it remains supported near $148 and $145.Ethereum price is trading with a positive bias versus the US Dollar, similar to bitcoin. ETH price needs to rally above $152 to continue higher in the coming sessions.Ethereum Price AnalysisAfter forming a support base above $144, Ethereum started a decent upward move against the US Dollar. ETH price is rising steadily and it recently climbed above the $148 resistance area.Moreover, there was a break above the $150 resistance and the 100 hourly simple moving average. However, the price ran into a crucial resistance area near $152, where the bears protected further upsides.A high is forming near $152 and the price is currently correcting lower. An immediate support is near the $149.50 area. Besides, the 50% Fib retracement level of the upward move from the $146 swing low to $152 high is also near $149.More importantly, there is a key bullish trend line forming with support near $148 on the hourly chart of ETH/USD. Therefore, Ethereum is likely to find a strong buying interest near the $149 and $148 levels.Additionally, the 61.8% Fib retracement level of the upward move from the $146 swing low to $152 high is near the $148 level and the 100 hourly simple moving average.If there is a downside break below the $148 support, the price could continue to move down towards the main $144 support area in the near term.Conversely, the bulls are likely to make another attempt to surpass the $152 resistance area. In the mentioned case, there are high chances of a sharp rally above the $152 and $155 resistance levels.The next major resistance is near the $158 level. Thus, a successful close above $158 could signal a trend change in the medium term and the price could climb towards $172.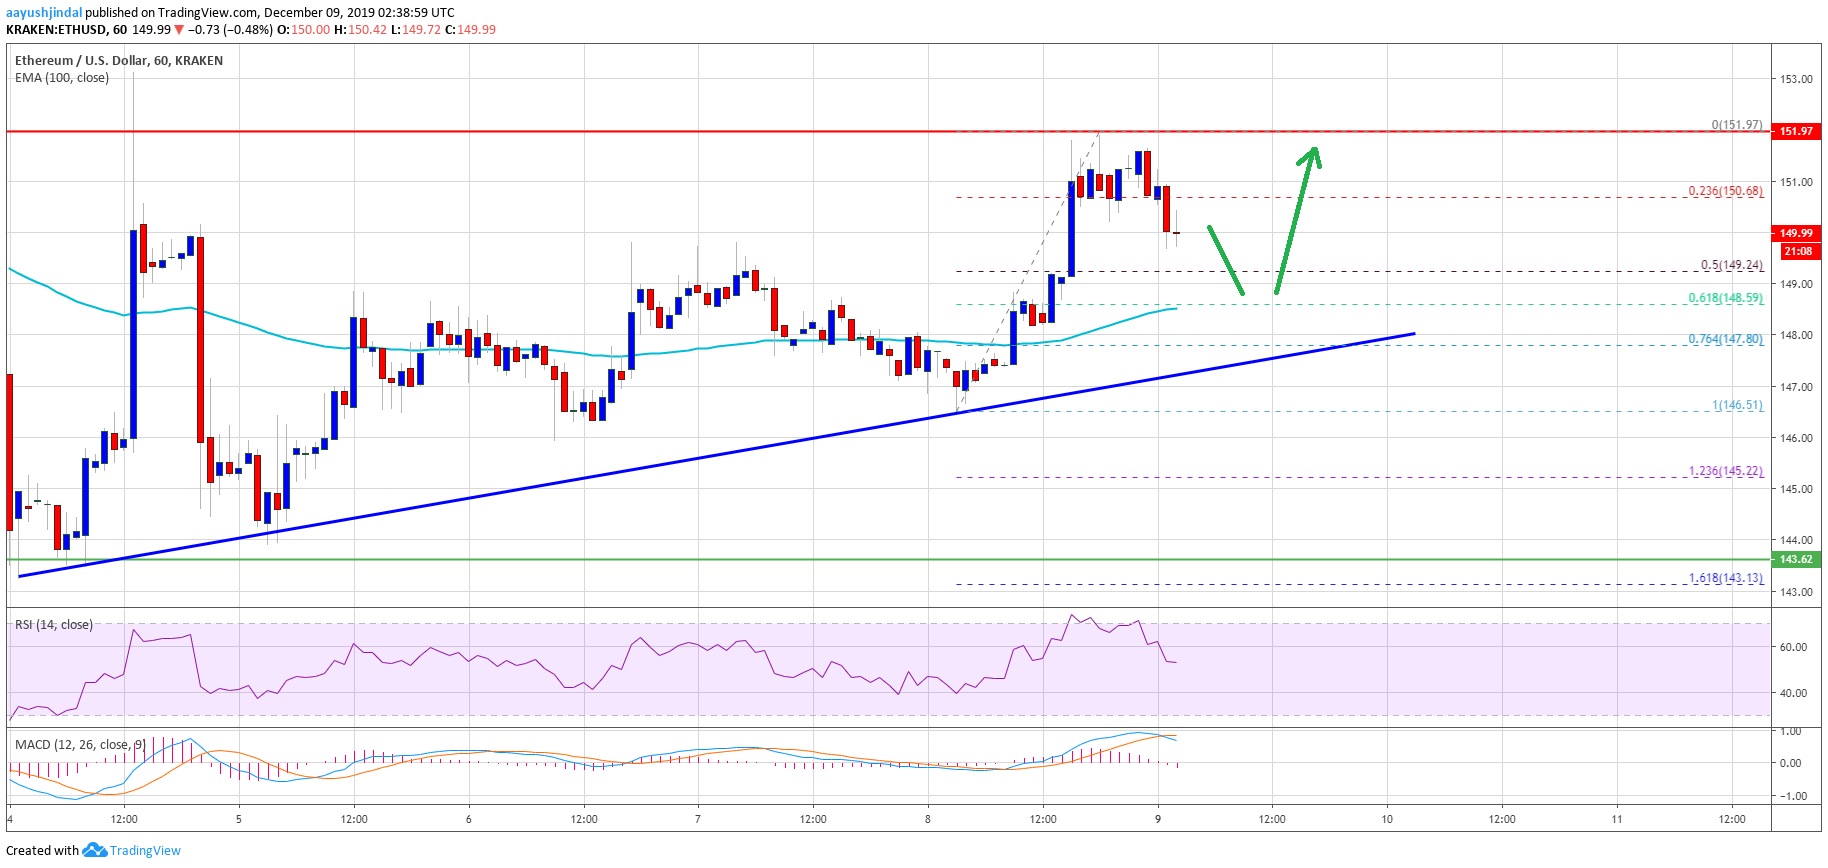 Ethereum PriceLooking at the chart, Ethereum price is trading in a positive zone above the $148 and $144 support levels. In the short term, there could be a downside correction, but the price is likely to bounce back.ETH Technical IndicatorsHourly MACD – The MACD for ETH/USD is slowly moving back into the bearish zone.Hourly RSI – The RSI for ETH/USD is currently just above the 50 level, with a few positive signs.Major Support Level – $144Major Resistance Level – $152The post appeared first on NewsBTC


