
Ethereum is down around 4% from the $138 high and tested the $130 support against the US Dollar.The price is currently consolidating above the $130 support, with a few bearish signs.There is a connecting bearish trend line forming with resistance near $132 on the hourly chart of ETH/USD (data feed via Kraken).Bitcoin failed to stay above $7,300 and it is now trading near the $7,240 support area.Ethereum price is facing an increase in selling versus the US Dollar due to a steady decline in bitcoin. ETH price could dive below the $128 level, if bitcoin slides below $7,200.Ethereum Price AnalysisAfter a strong upward move above $135, Ethereum price faced resistance near the $138 zone against the US Dollar. ETH price topped near the $138 level and recently corrected below $135.Moreover, there was a break below the $132 support, plus the 61.8% Fib retracement level of the latest rally from the $127 low to $138 high. The price tested the $130 support and the 100 hourly simple moving average.It seems like Ethereum is currently consolidating near $130 and the 100 hourly simple moving average. An initial resistance is near the $132 level. Besides, the 23.6% Fib retracement level of the recent decline from the $138 high to $130 low is also near $132.More importantly, there is a connecting bearish trend line forming with resistance near $132 on the hourly chart of ETH/USD. Therefore, a clear break above the $132 resistance might start a strong increase towards the $135 and $138 resistance levels.An intermediate resistance could be $134 or the 50% Fib retracement level of the recent decline from the $138 high to $130 low.Conversely, Ethereum might struggle to gain momentum above the $132 and $133 levels. In the mentioned bearish case, the price could struggle to stay above $130 and the 100 hourly SMA.If there is a close below $130 and the 100 hourly SMA, the bears are likely to gain traction and the price may perhaps slide towards the $125 support area.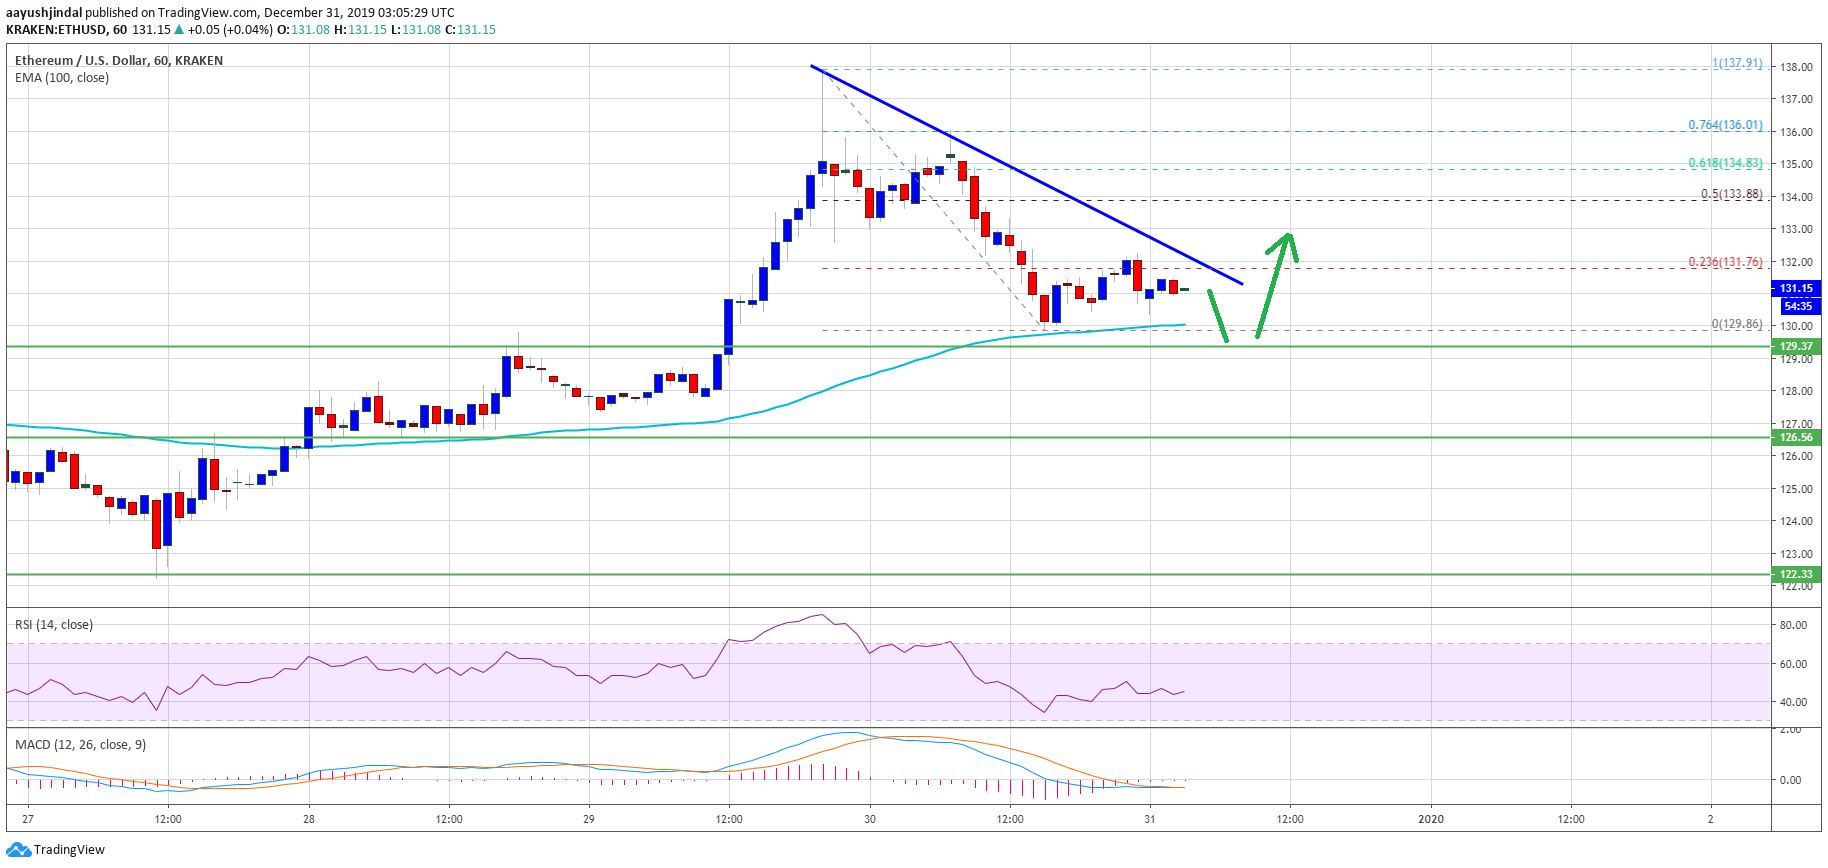 Ethereum PriceLooking at the chart, Ethereum price is back to the main $130 support area. If bitcoin slides below the $7,200 support area, there is a risk of a sharp decline in ETH in the near term. If not, it might start a fresh increase towards $135 and $138 in the coming sessions.ETH Technical IndicatorsHourly MACD – The MACD for ETH/USD is slowly moving into the bullish zone.Hourly RSI – The RSI for ETH/USD is currently moving higher towards the 50 level.Major Support Level – $130Major Resistance Level – $132The post appeared first on NewsBTC


