
Ethereum is struggling to clear the key $152 resistance area against the US Dollar.The price is declining and it is now trading near the $146 support area.Yesterday’s major bullish trend line was breached with support near $148 on the hourly chart of ETH/USD (data feed via Kraken).The price could continue to move down and it might test the $144 support zone.Ethereum price is showing a few bearish signs versus the US Dollar, while bitcoin is down 2%. ETH price must stay above $144 to revisit the $152 resistance area.Ethereum Price AnalysisYesterday, Ethereum made another attempt to surpass the $152 resistance area against the US Dollar. However, ETH price struggled to continue higher, formed a top near the $152 level, and declined recently.The price traded below the $150 and $148 levels. Moreover, there was a close below the $148 level and the 100 hourly simple moving average. Besides, yesterday’s major bullish trend line was breached with support near $148 on the hourly chart of ETH/USD.The pair is now trading near the $146 support level. If the price fails to stay above the $146 support, it could decline further towards the key $144 area. Any further losses might lead Ethereum towards the $142 level in the near term.On the upside, an immediate resistance is near the $148 level. Additionally, the 23.6% Fib retracement level of the recent decline from the $152 high to $146 low is also near the $148 level.The first key resistance is near the $150 level since it is close to the 100 hourly simple moving average. The 50% Fib retracement level of the recent decline from the $152 high to $146 low is also near the $150 level.More importantly, the $152 level remains a strong barrier for the bulls. Bitcoin price is also declining and struggling to stay above the $7,320 level. Therefore, there is a risk of an extended decline in ETH below the $146 and $144 support levels in the near term.To move into a positive zone, the price must break the $150 level and gain strength above the $152 hurdle.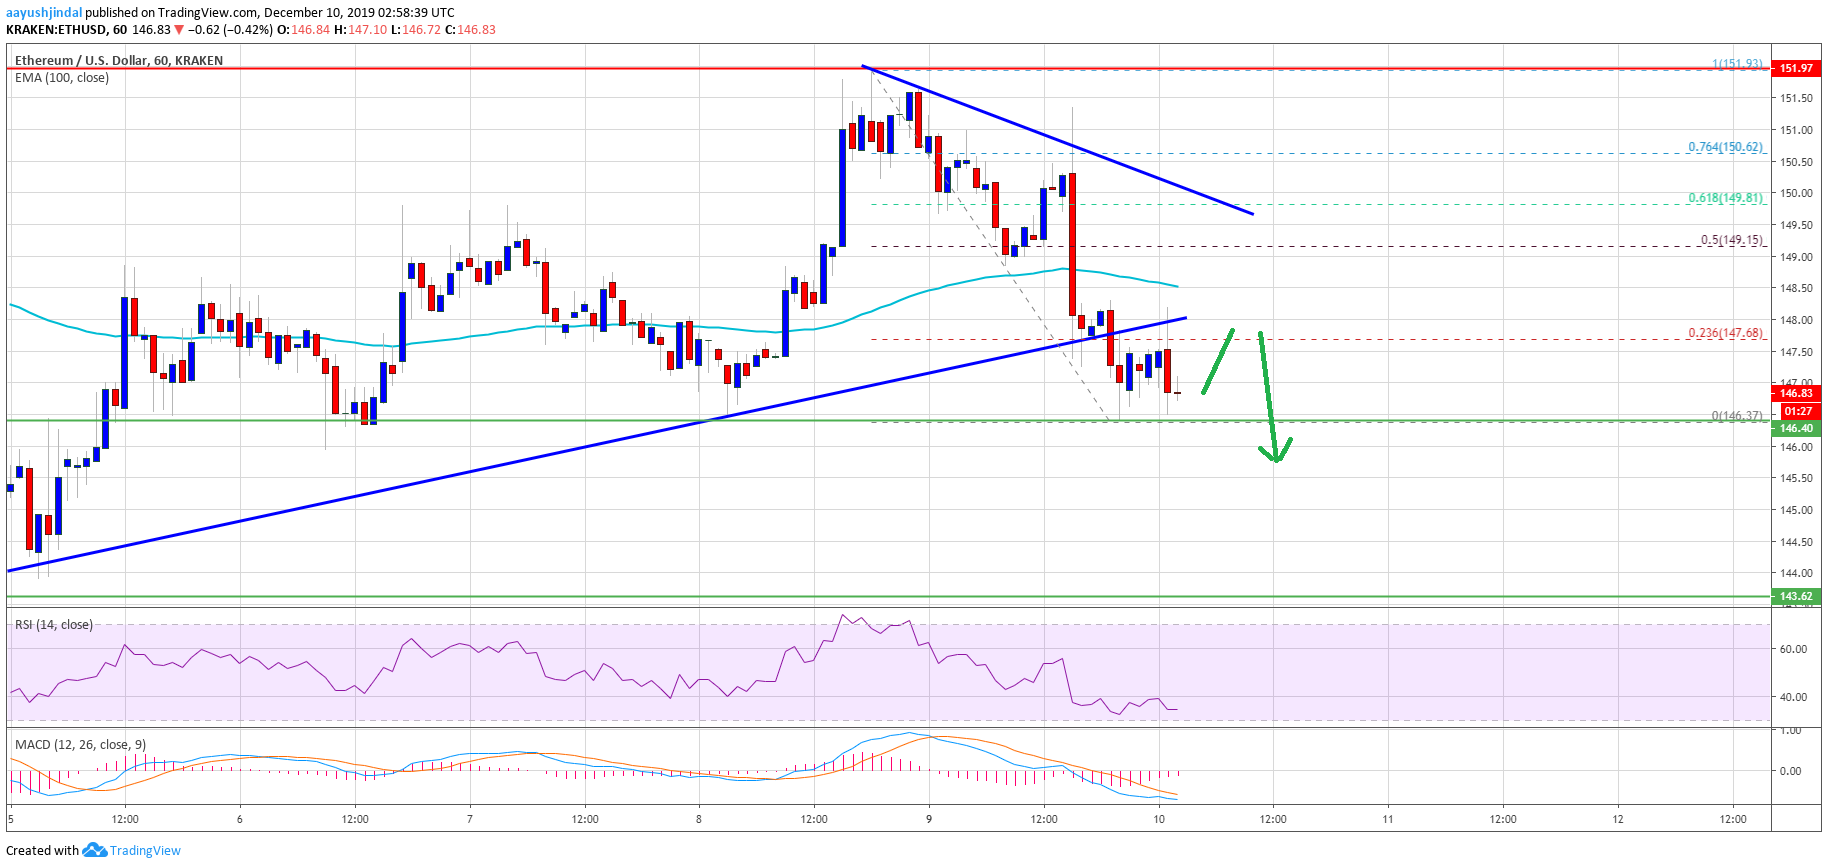 Ethereum PriceLooking at the chart, Ethereum price is clearly back in a range, with a significant resistance near the $152 level. On the downside, the price must stay above $144 or $142 to recover again. If not, it could continue to move down towards $132.ETH Technical IndicatorsHourly MACD – The MACD for ETH/USD is slowly gaining strength in the bearish zone.Hourly RSI – The RSI for ETH/USD is now well below the 40 level, with a bearish angle.Major Support Level – $144Major Resistance Level – $152The post appeared first on NewsBTC


