
- Ethereum has seen a small 3% price increase over the past 7 days as it trades at the $130 level.
- Against BTC, ETH still is struggling to break above the resistance at 0.01820 BTC.
- Ethereum must break above $135 to turn bullish.
Key Support & Resistance Levels
Support: $128, $120, $118.
Resistance: $133.50, $145, $152.
Support: 0.0171 BTC, 0.0169 BTC, 0.0164 BTC.
Resistance: 0.0179 BTC, 0.0184 BTC, 0.019 BTC.
ETH/USD – ETH Still Struggling To Break $133.50
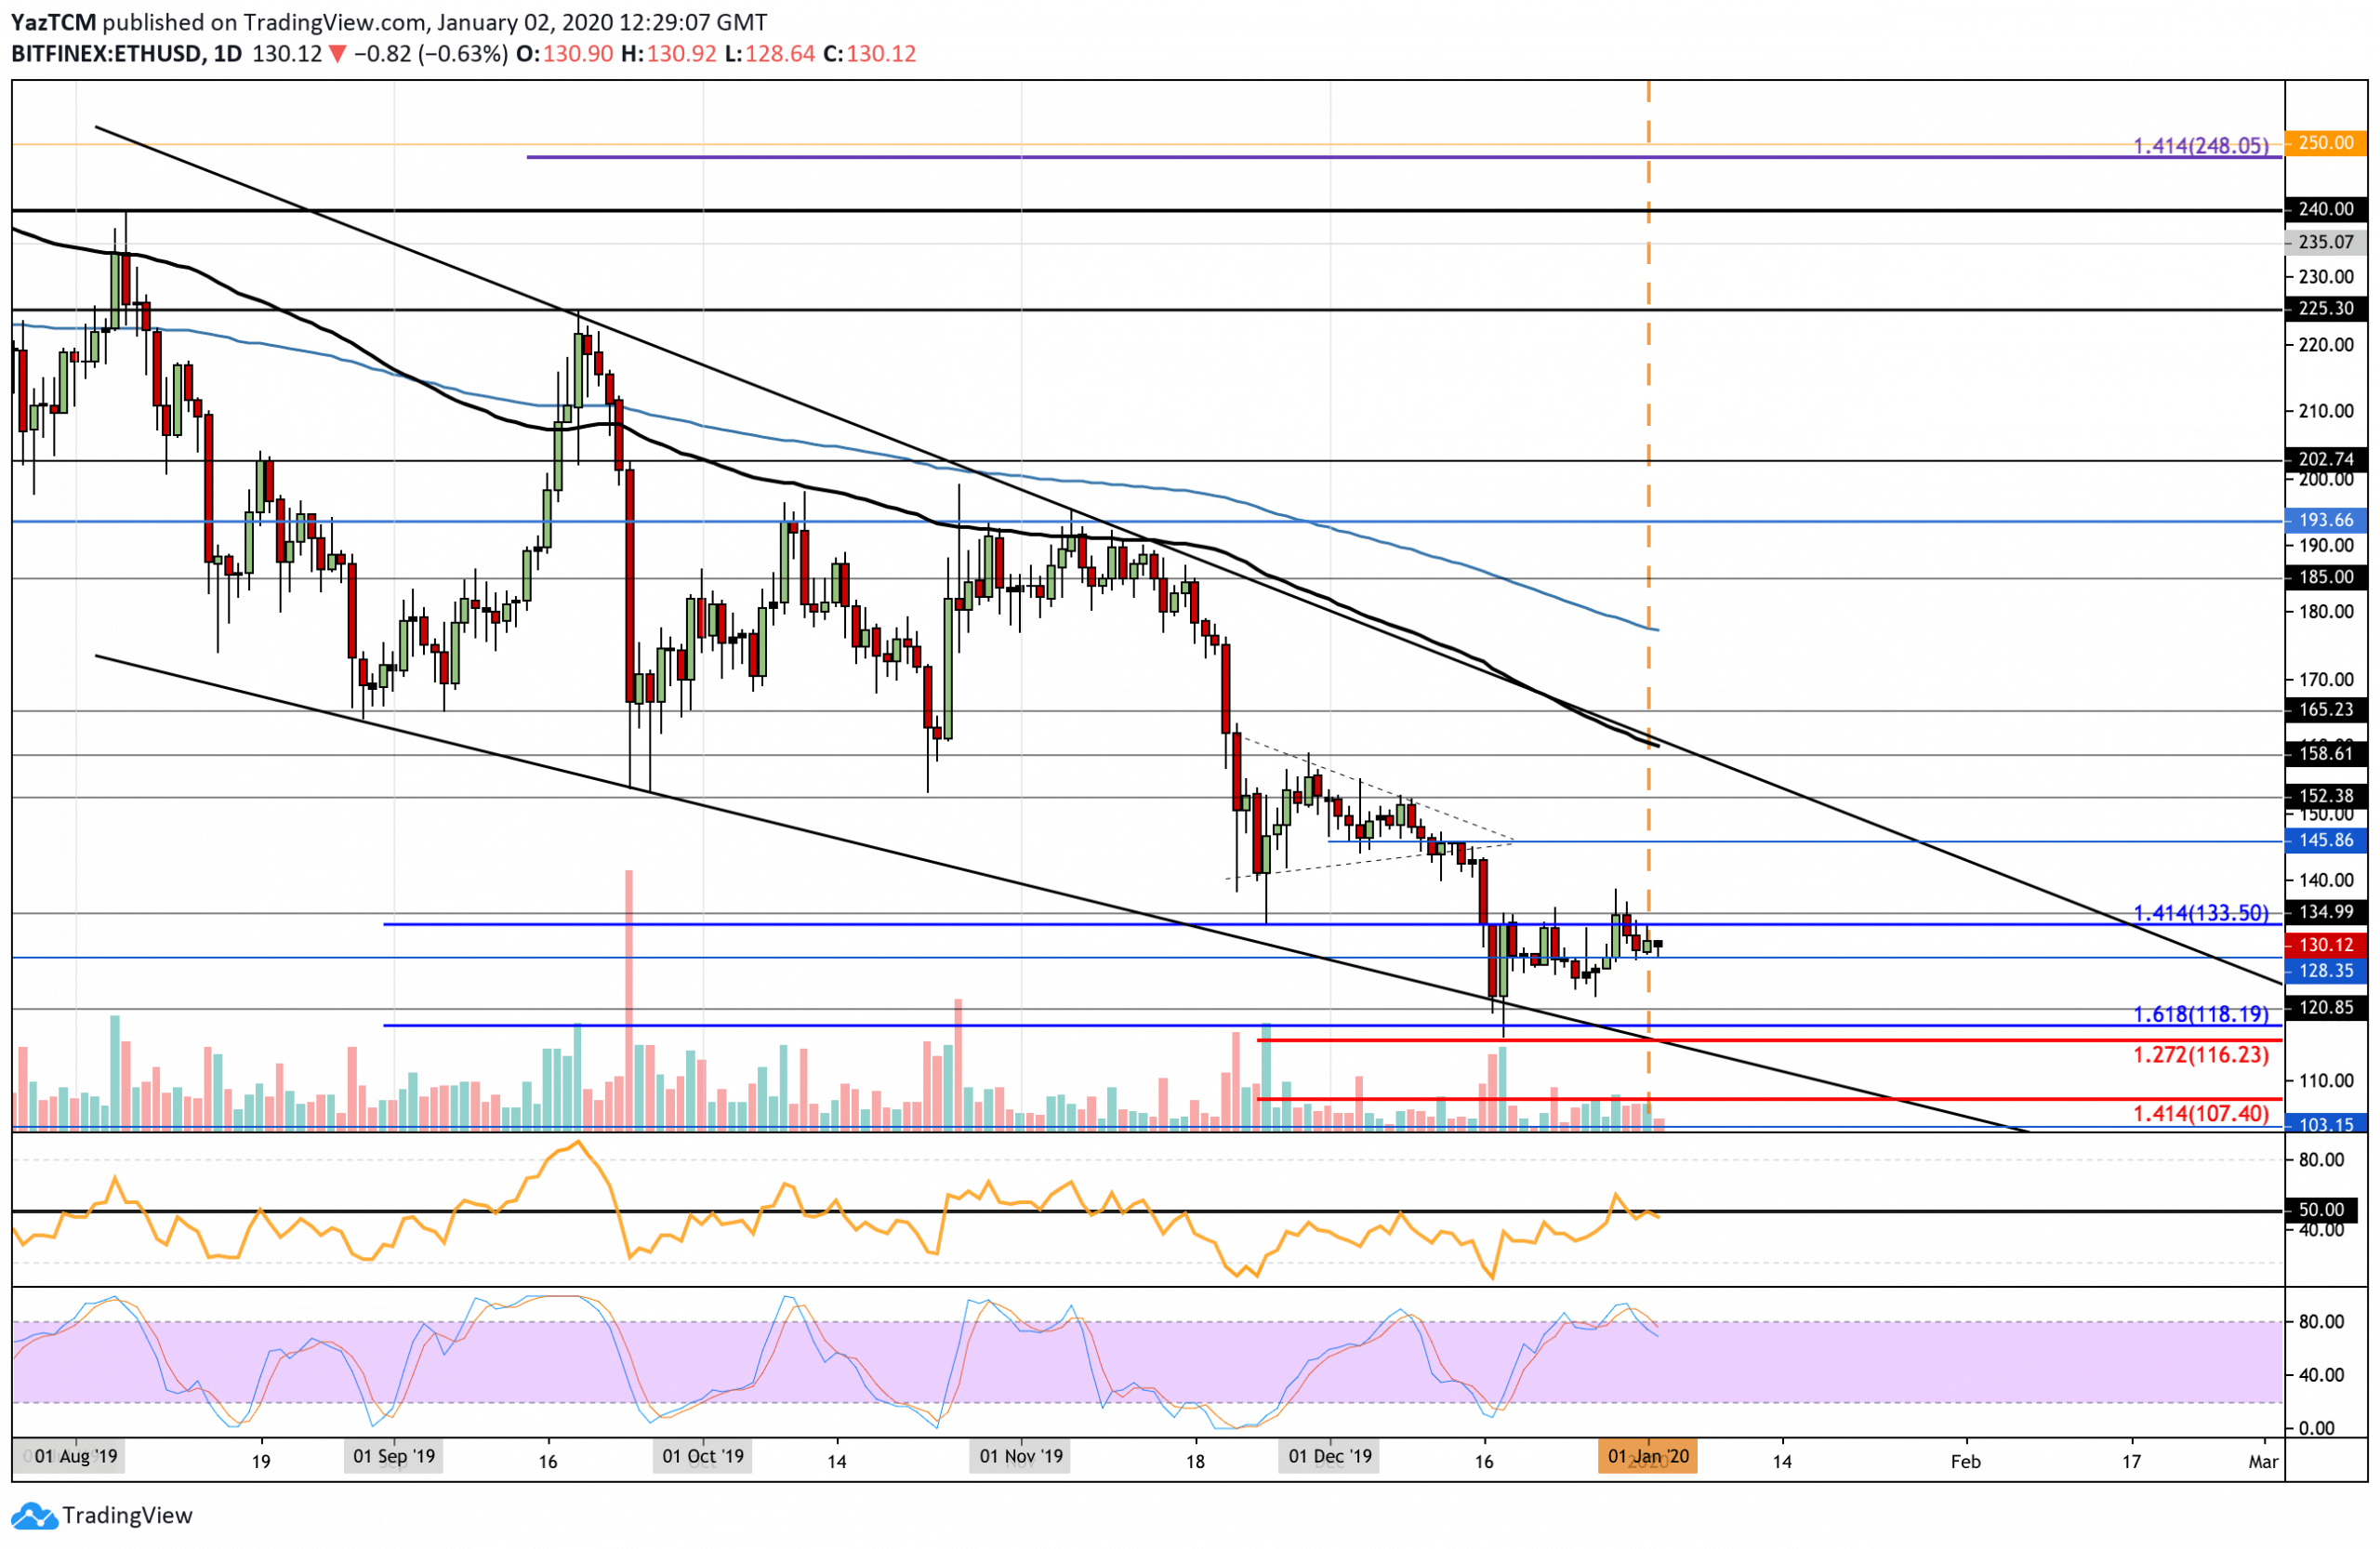
Since our last analysis, ETH rolled over from the resistance at $135, causing it to fall into the support at $128.35. The bulls have defended this area, however, the momentum is certainly within the bearish favor at this moment.
If ETH was to drop and fall back beneath the $120 level, the market would be considered bearish. On the other hand, to turn bullish, Ethereum must rise and break above the December highs at $152.
Ethereum Short Term Price Prediction
If the bulls defend the support at $128 and push ETH above $135, an initial resistance is then located at $146, $152, and $158 (100-days EMA). Above this, resistance lies at $165 and $180 (200-days EMA). Alternatively, if the sellers push ETH beneath $128, support lies at $125, and $120. Beneath this, added support is found at $116.
The RSI attempted to break above the 50 level but failed to do so, which shows that the sellers remain in control over the market momentum. Furthermore, the Stochastic RSI recently produced a bearish crossover signal that should help to send the market lower.
ETH/BTC – ETH Fails To Make Movement Above 0.0182 BTC.
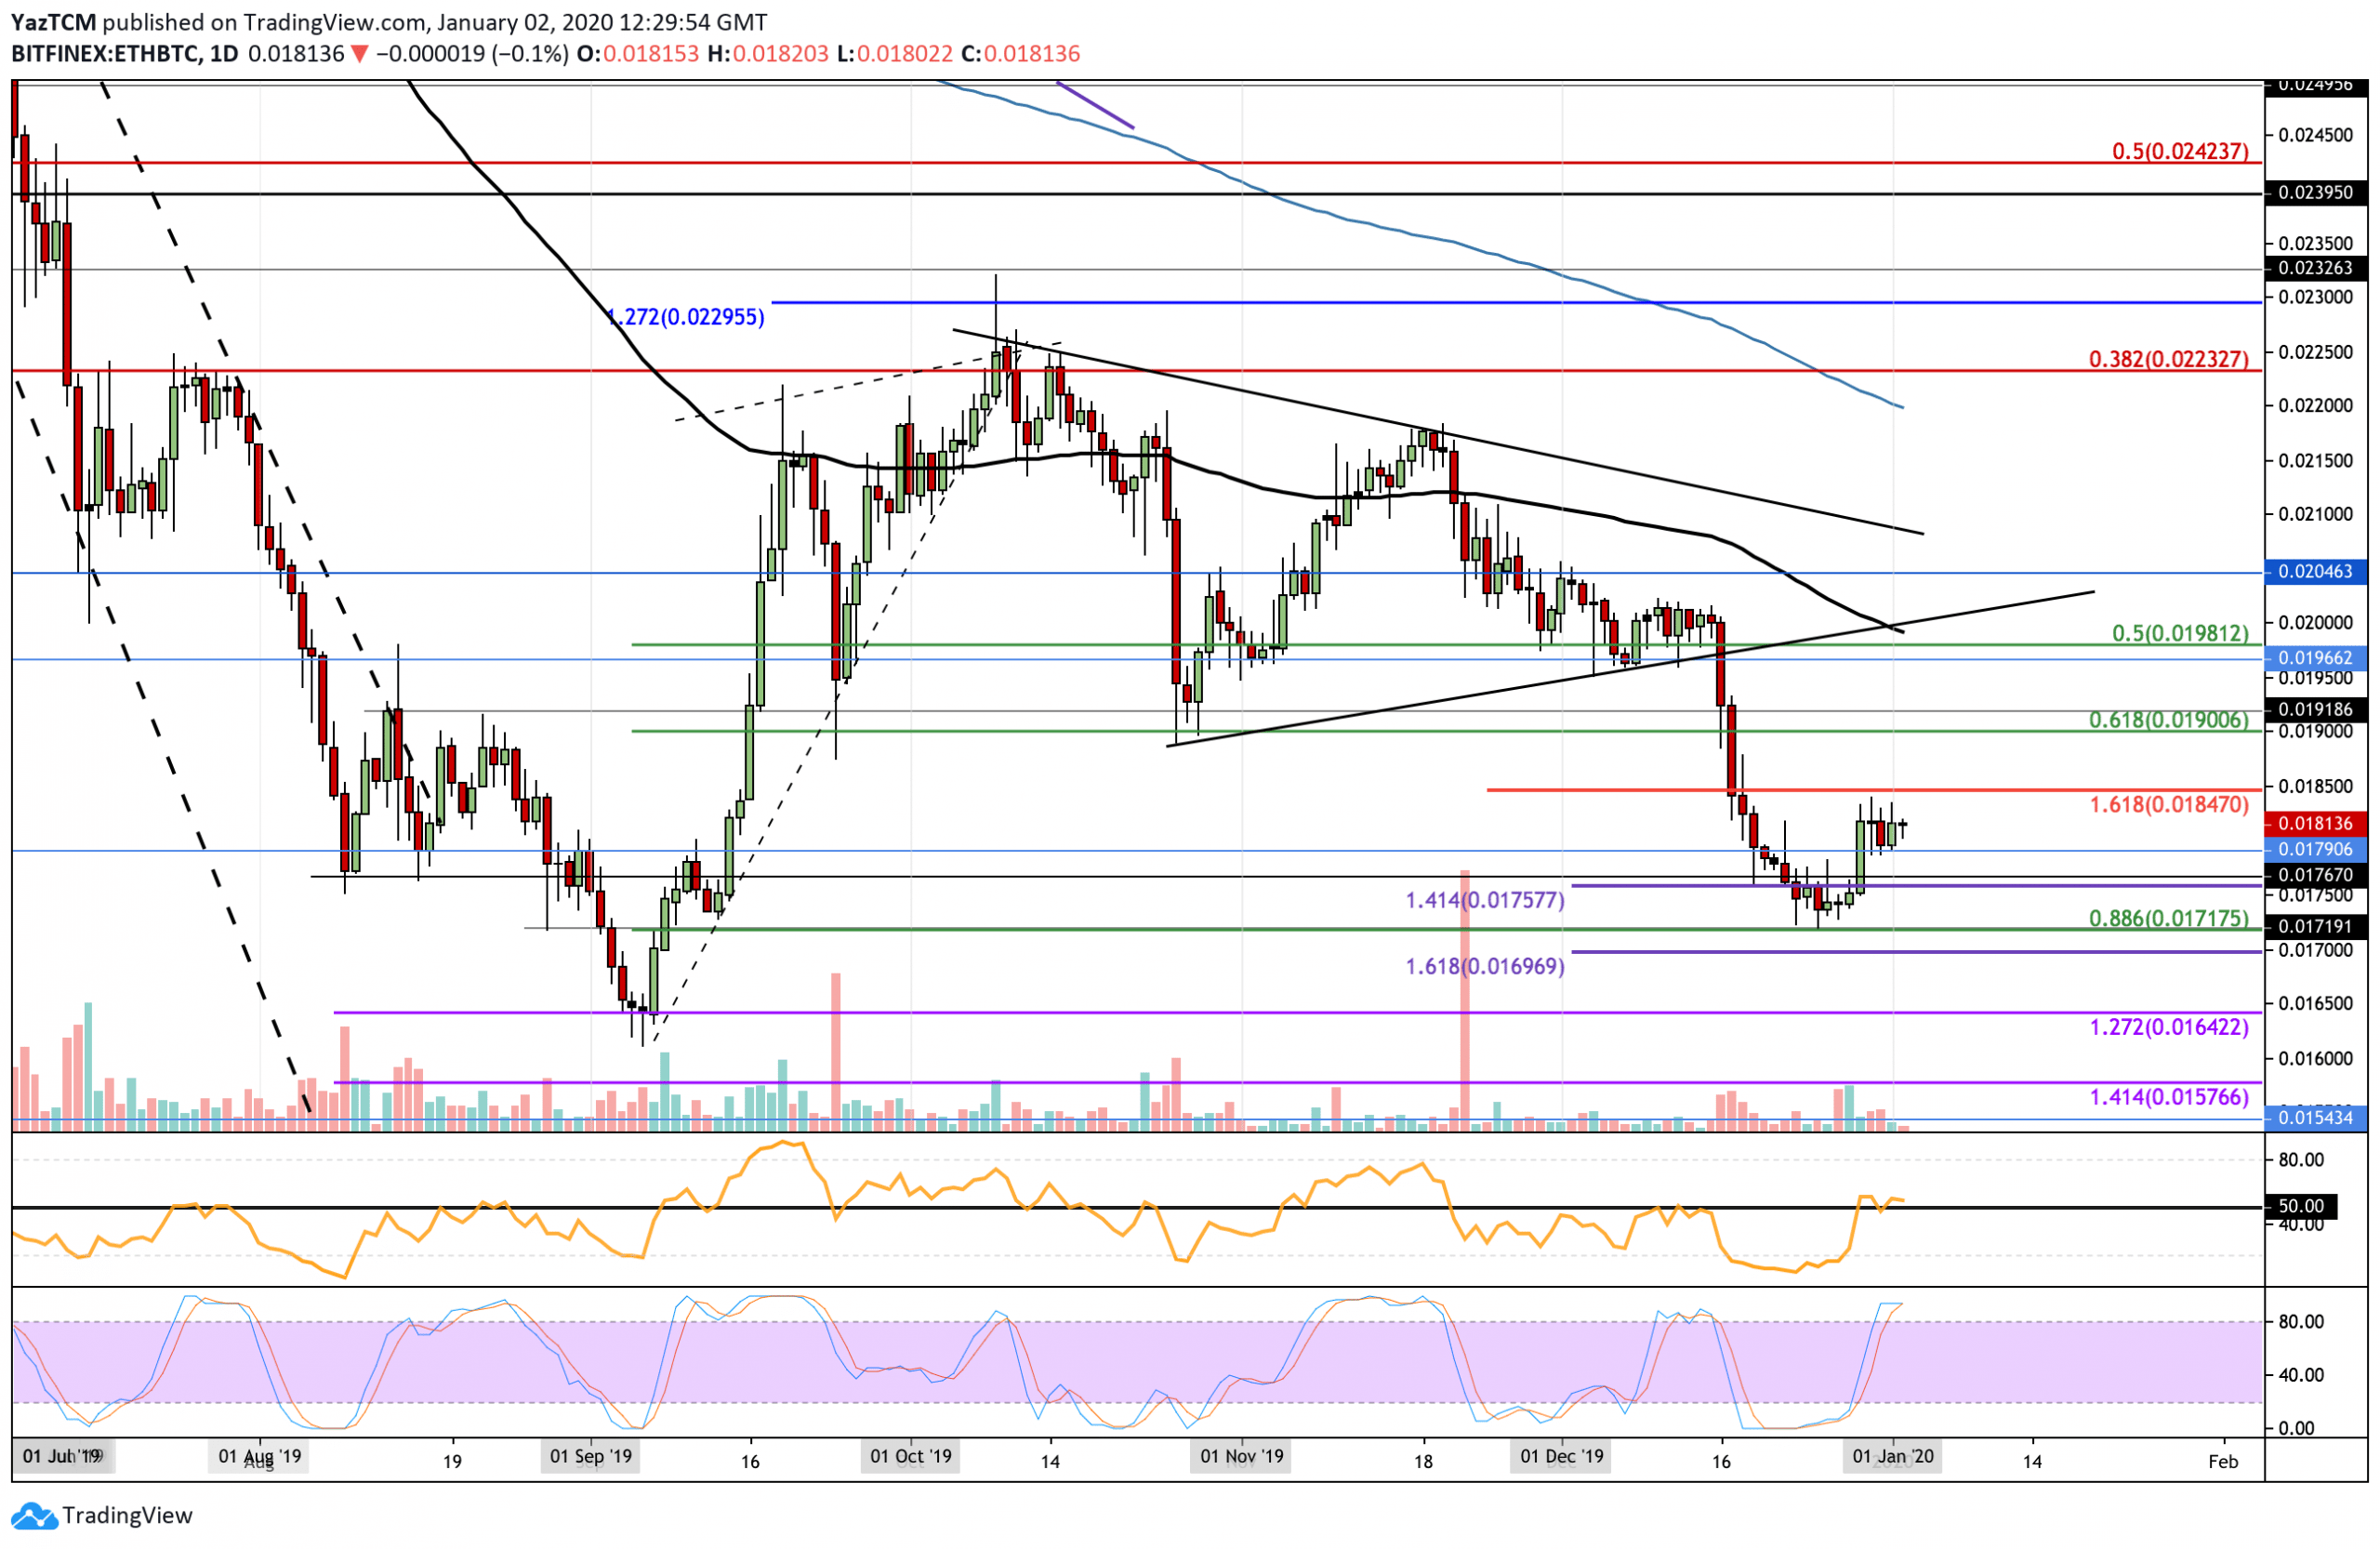
Against Bitcoin, ETH has remained positive but failed to break above resistance at around 0.0182 BTC. The cryptocurrency has traded sideways as it remains supported at the 0.0179 BTC level.
For this market to be considered as bullish, ETH must rise and penetrate back above the 0.02 BTC level. If ETH was to drop beneath the support at 0.0171 BTC, then the market would be considered bearish.
Ethereum Short Term Price Prediction
If the bulls manage to break above 0.0182 BTC, immediate higher resistance lies at 0.0185 BTC. Then, resistance lies at 0.019 BTC, 0.196 BTC, and 0.020 BTC (100-days EMA). On the other hand, if the sellers push ETH beneath 0.0179 BTC, immediate support is found at 0.0175 BTC and 0.0181 BTC (.886 Fibonacci Retracement level). Beneath this, additional support is found at 0.0169 BTC and 0.01642 BTC.
The RSI is marginally above the 50 level which shows indecision within the market at this moment in time. Worryingly, the Stochastic RSI is primed for a bearish crossover signal that should send the market lower.
Disclaimer: Information found on CryptoPotato is those of writers quoted. It does not represent the opinions of CryptoPotato on whether to buy, sell, or hold any investments. You are advised to conduct your own research before making any investment decisions. Use provided information at your own risk. See Disclaimer for more information.
Cryptocurrency charts by TradingView.
Technical analysis tools by Coinigy.
You might also like:
The post appeared first on CryptoPotato


