
ETH/USD – Ethereum Stalls At Price Channel Upper Border
Key Support Levels: $456, $438, $430.
Key Resistance Levels: $475, $490, $500.
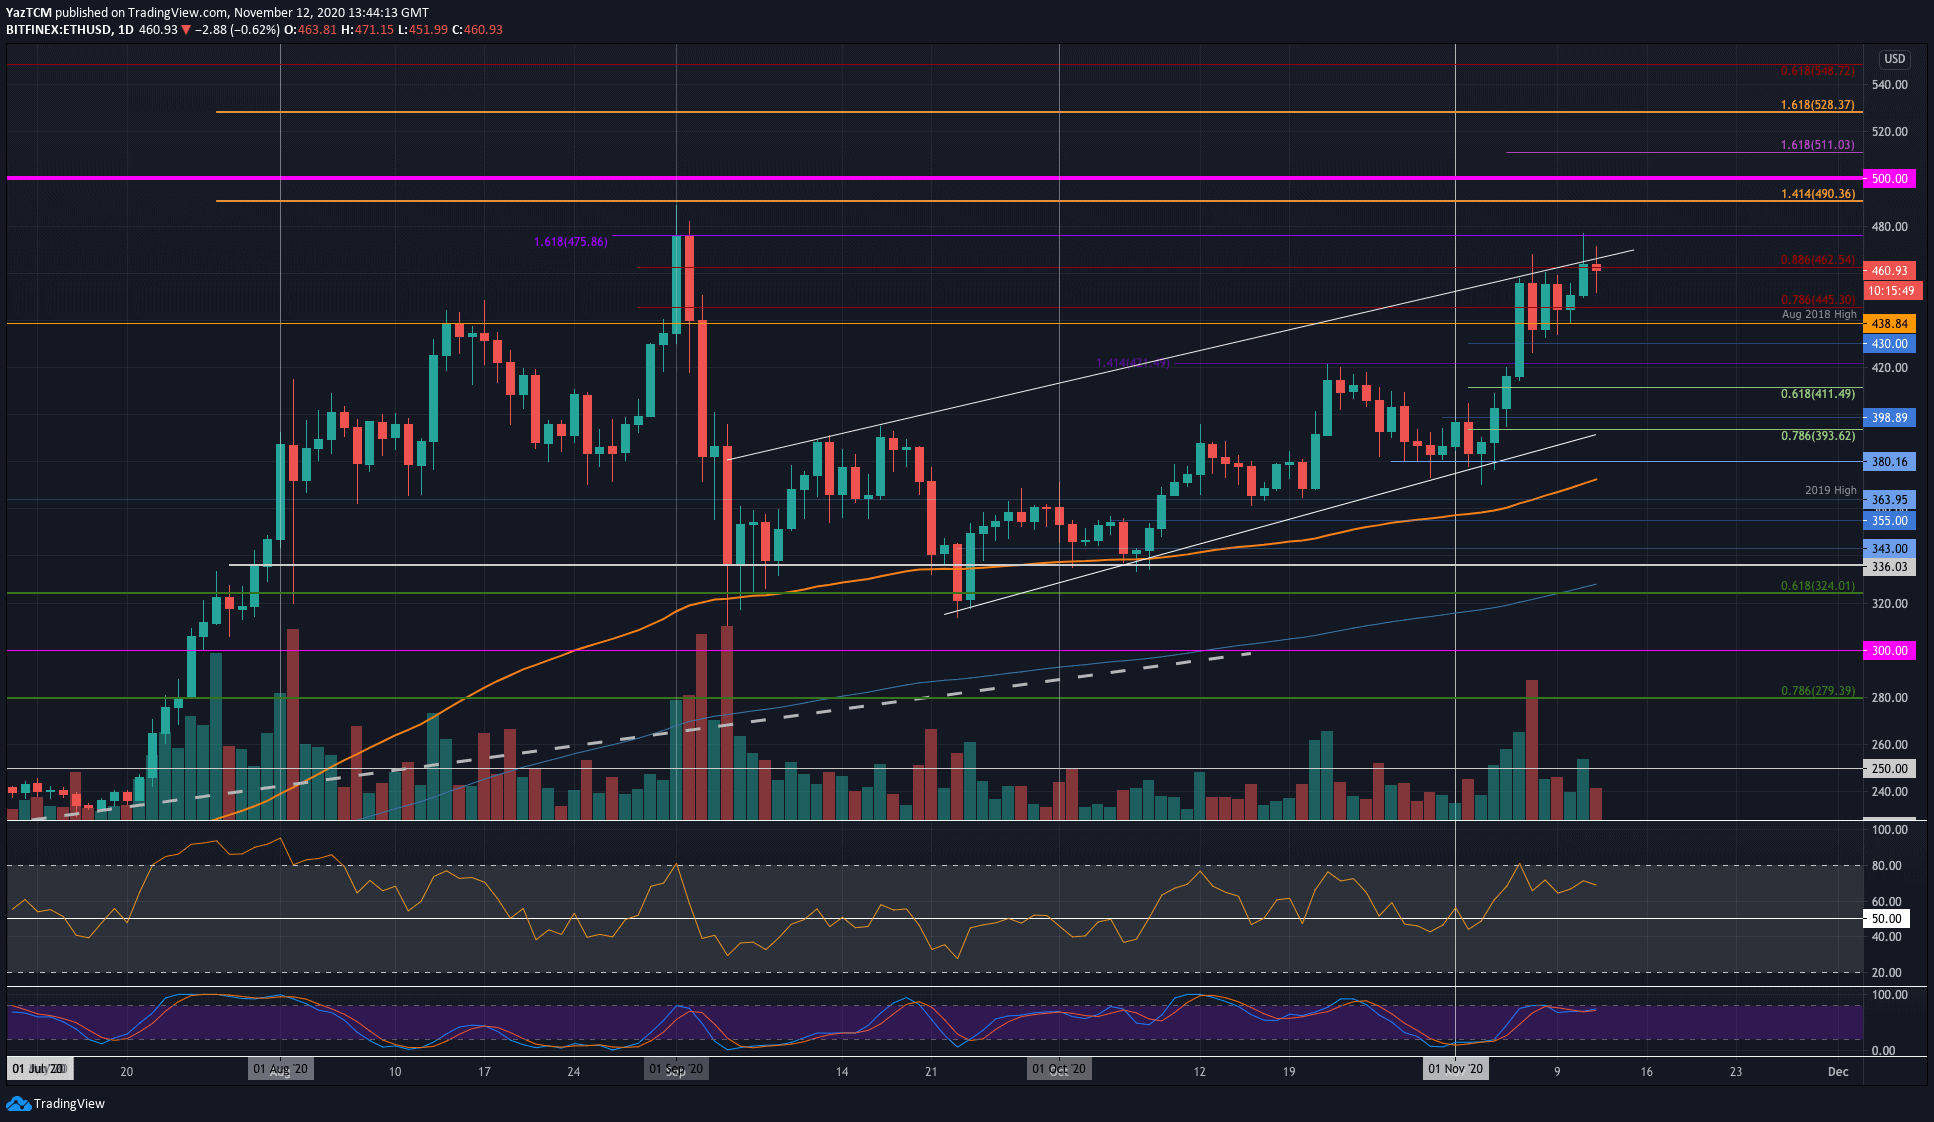
Yesterday, Ethereum managed to create a fresh high for November (and a new 2-month high) as it spiked into the $475 resistance (September high-day closing price). Before this, it was struggling to close above $456 for the past five days of trading.
Unfortunately, ETH ran into the upper border of a rising price channel and struggled to break above here. This, combined with the bearish divergence forming, adds up to be a negative sign for the bulls in the short term.
ETH-USD Short Term Price Prediction
Looking ahead, if the sellers roll over from here, the first level of support lies at $456. Beneath this, support lies at $438 (August 2018 High), $430, $421, and $411 (.618 Fib Retracement).
On the other side, if the buyers can break the resistance at the upper border of the price channel, the first level of resistance lies at $475 (September high-day close). Above this, resistance is expected at $490, $500, and $511 (1.618 Fib Extension).
As mentioned, the RSI is starting to form bearish divergence. While price action continues to make higher highs, the RSI fails to make higher highs, which leads to bearish divergence. This signals that a potential rollover is potentially imminent.
ETH/BTC – Buyers Fail To Overcome 200-days EMA
Key Support Levels: 0.0285 BTC, 0.0278 BTC, 0.0272 BTC.
Key Resistance Levels: 0.0295 BTC, 0.03 BTC, 0.0305 BTC.
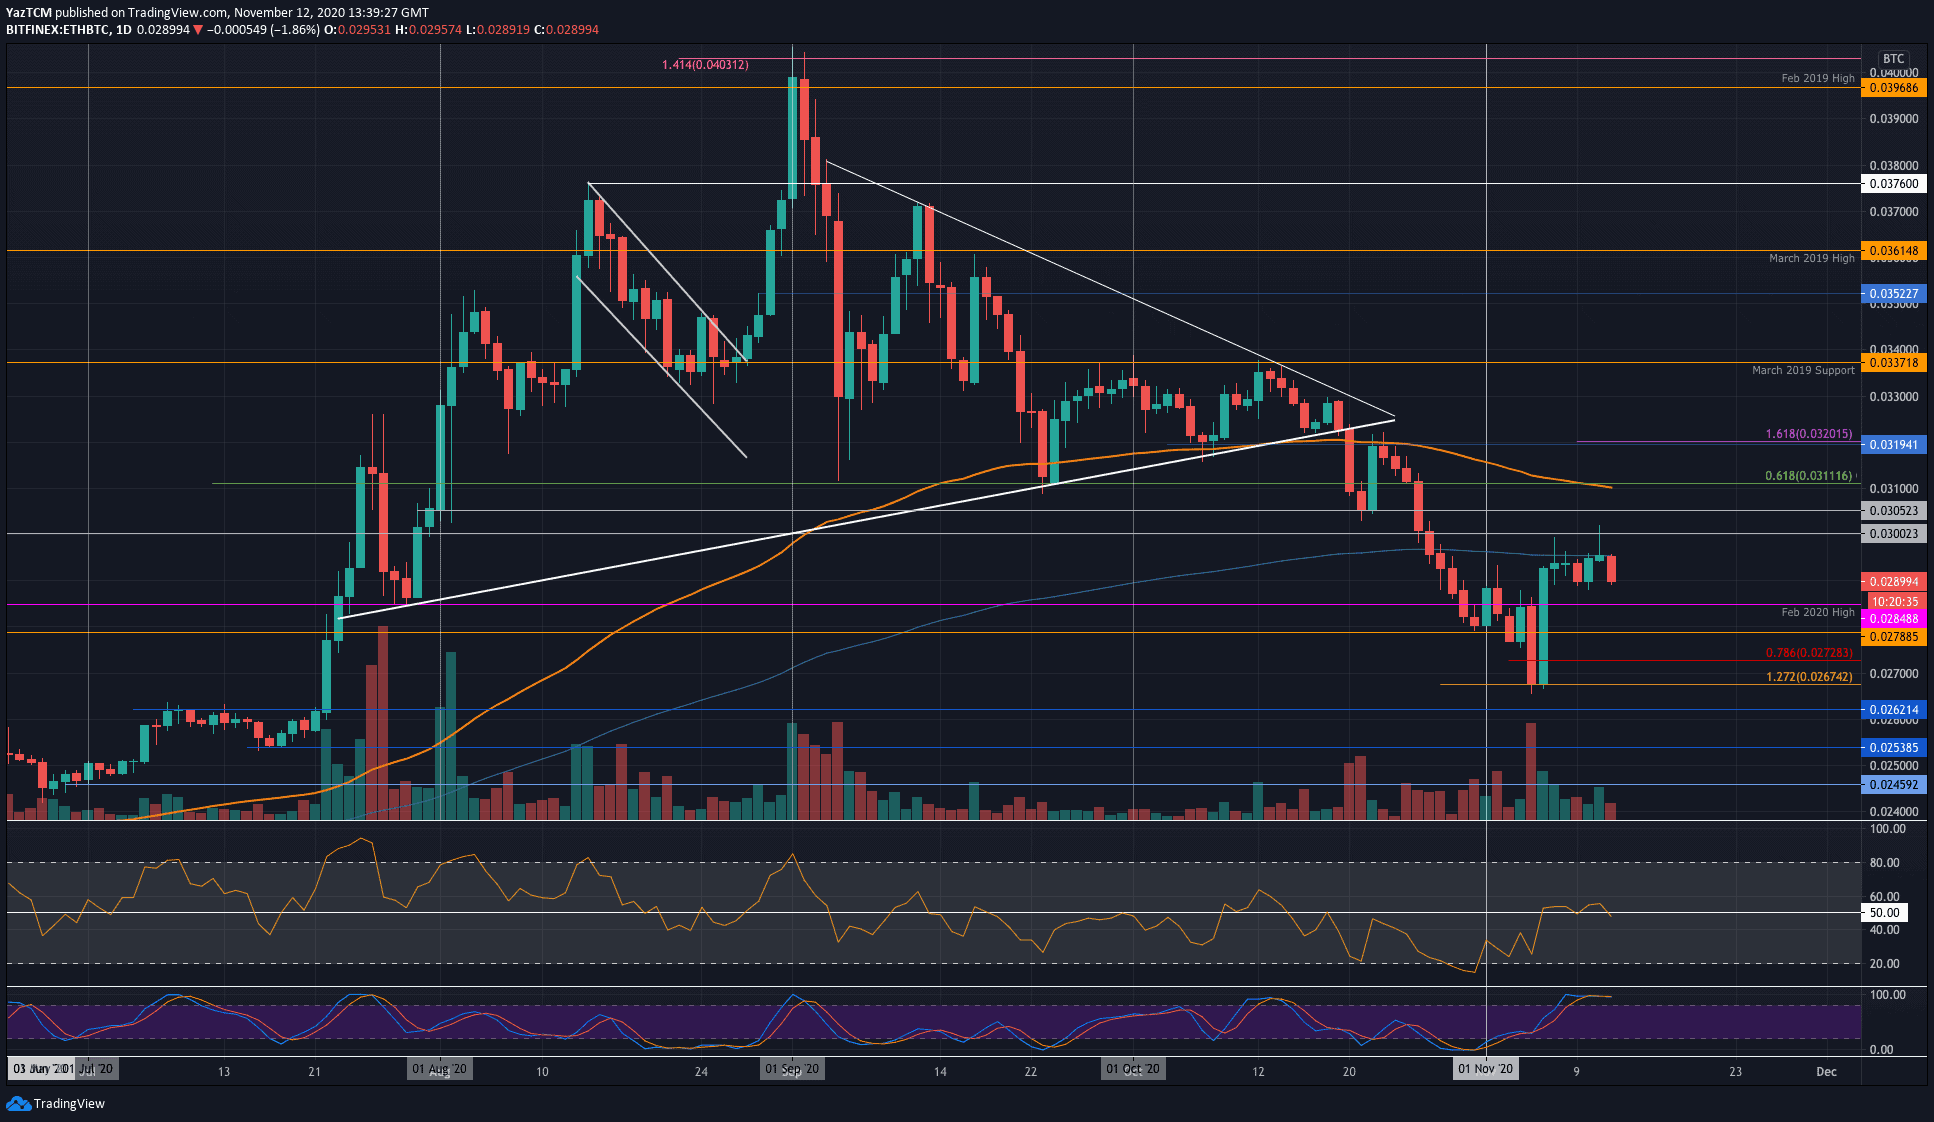
Against Bitcoin, ETH managed to spike above the 0.030 BTC level yesterday. However, it failed to close the daily candle above the 200-days EMA at around 0.0295 BTC. It has struggled to break this level throughout the entire period of November.
As a result, Ethereum headed lower today as it crashes to the 0.029 BTC level.
ETH-BTC Short Term Price Prediction
Looking ahead, if the sellers continue to push lower, the first level of support lies at 0.0285 BTC (Feb 2020 High). Beneath this, support lies at 0.0278 BTC, 0.0272 BTC (.786 Fib), and 0.0267 BTC.
On the other side, the first level of resistance lies at 0.0295 BTC (200-days EMA). Above this, resistance is expected at 0.03 BTC, 0.0305 BTC, and 0.031 BTC (100-days EMA).
The RSI recently dipped back beneath the mid-level to indicate the bears have retaken control of the market momentum. Additionally, the Stochastic RSI is primed for a bearish crossover signal that should send ETH lower.
Binance Futures 50 USDT FREE Voucher: Use this link to register & get 10% off fees and 50 USDT when trading 500 USDT (limited offer).
Disclaimer: Information found on CryptoPotato is those of writers quoted. It does not represent the opinions of CryptoPotato on whether to buy, sell, or hold any investments. You are advised to conduct your own research before making any investment decisions. Use provided information at your own risk. See Disclaimer for more information.
The post appeared first on CryptoPotato


