
TL;DR
- Ethereum had increased by 6% over the past three days to reach the $185 resistance, before stalling.
- Against Bitcoin, ETH rebounded from the 0.0185 BTC to return to the 100-days EMA.
- Ethereum is now trading above the 200-days EMA as it sets sights to $200.
Key Support & Resistance Levels
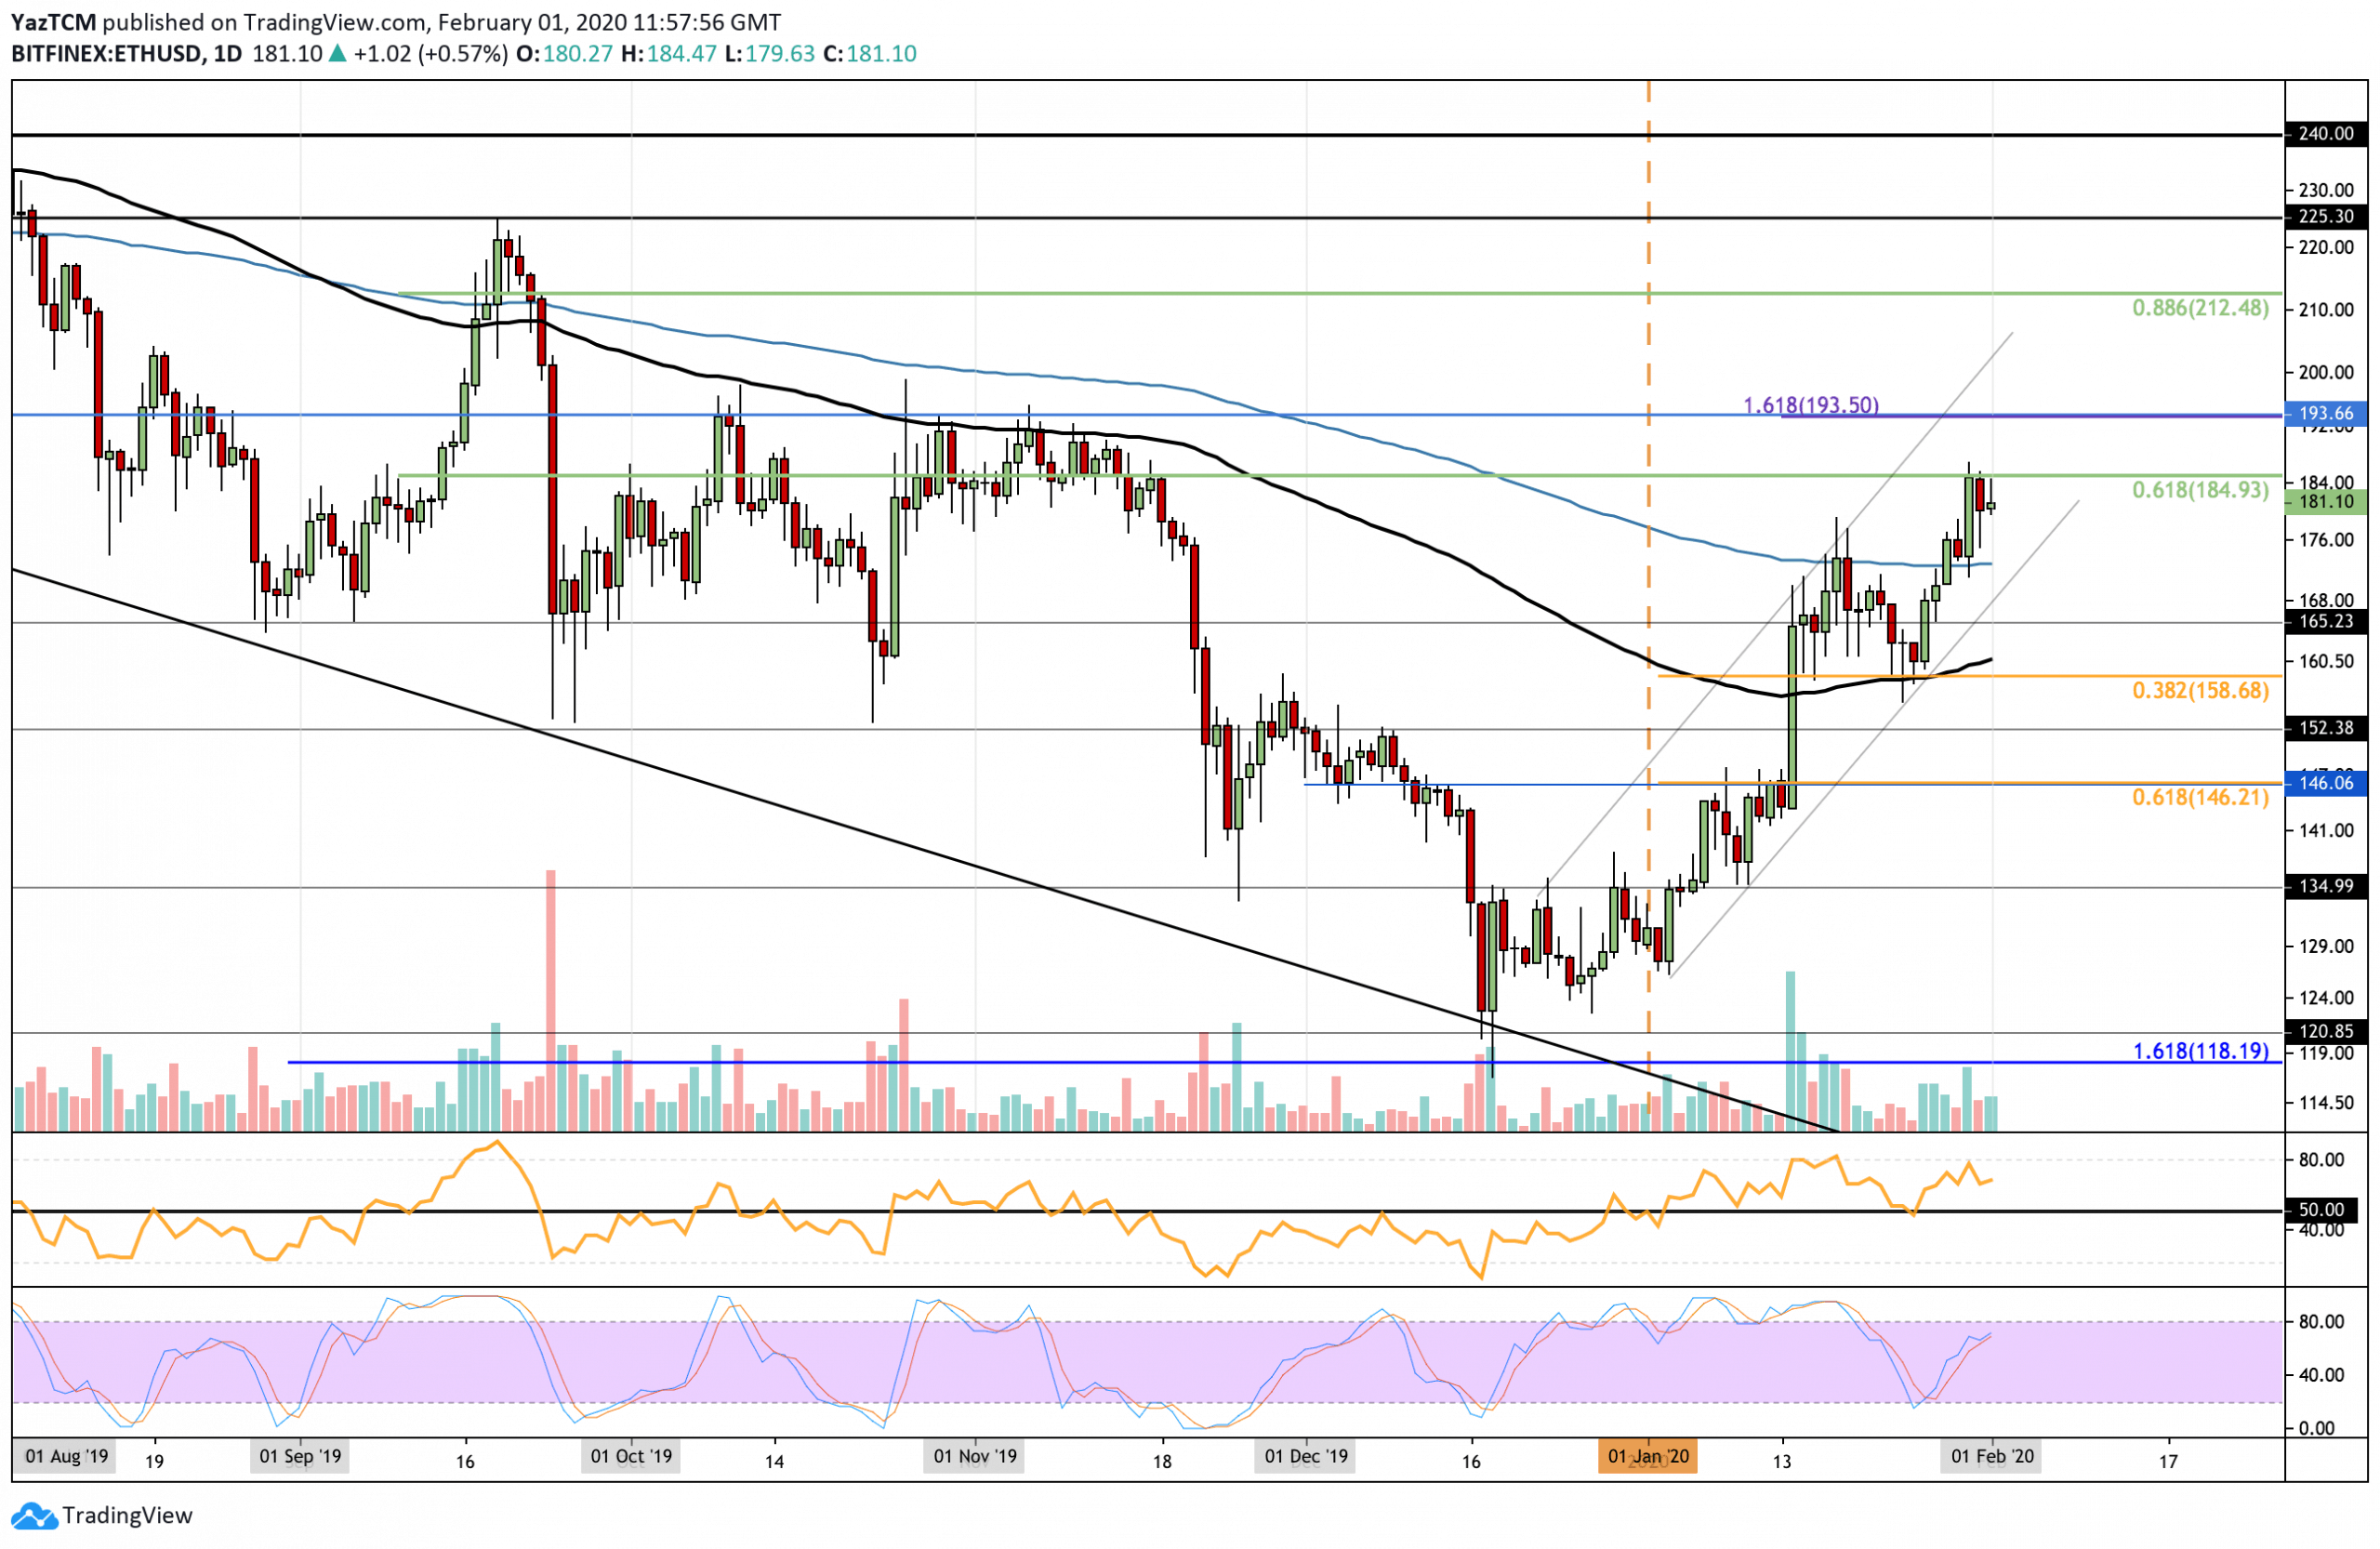
Support: $172, $165, $158.
Resistance: $185, $194, $200.
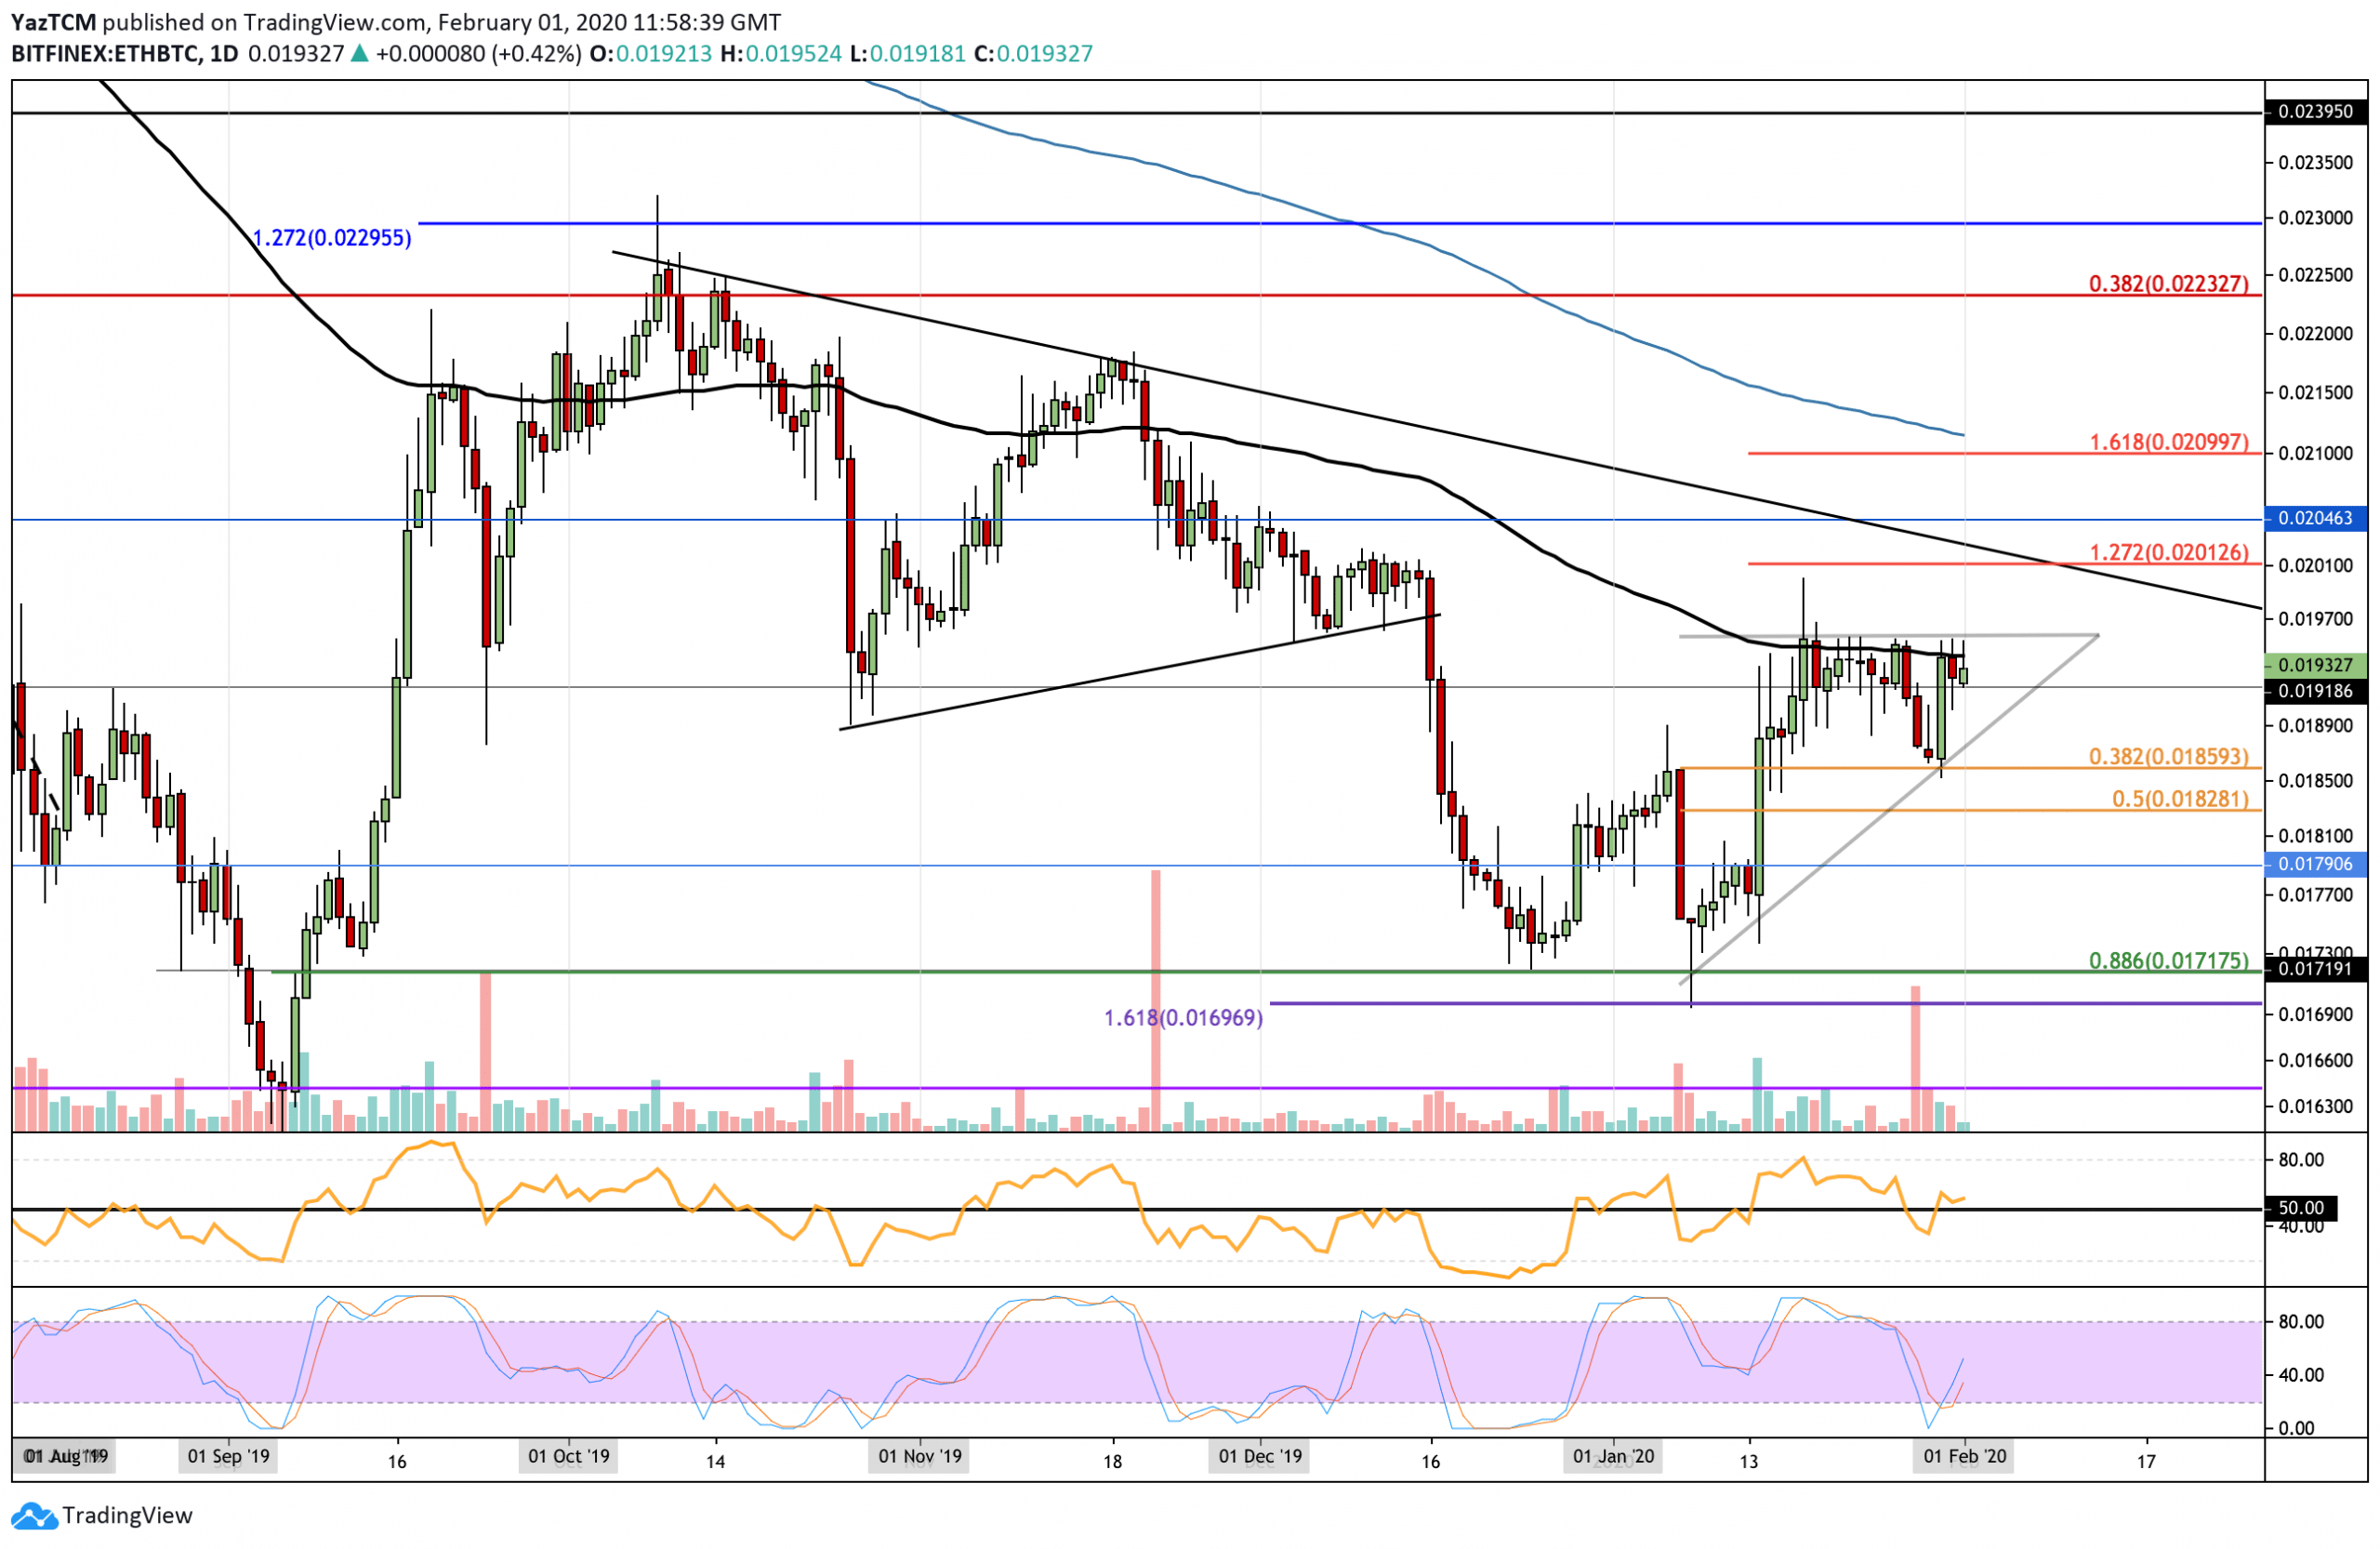
Resistance: 0.02 BTC, 0.0204 BTC, 0.021 BTC.
Support: 0.0185 BTC, 0.0182 BTC, 0.0179 BTC.
ETH/USD – ETH Breaks 200-days EMA
Since our last analysis, ETH broke through the 200-days EMA to reach higher resistance at $185, which is provided by a bearish .618 Fibonacci Retracement.
The cryptocurrency was struggling at the $176 level during January but managed to rise above this toward the end of the month.
Ethereum has now confirmed the bullish trend with the break above $176. However, as long as the coin will stay above $165, the trend would stay.
Ethereum Short Term Price Prediction
If the bulls continue to drive ETH above $185, the next level of resistance lies at $194, which provided “problems” for the cryptocurrency during both October and November 2019. Higher resistance is expected at $200 and $212 (bearish .886 Fib Retracement).
Alternatively, if the sellers push ETH lower, support is found at $172. Beneath this, additional support lies at $165 and $158 (short term .382 Fib Retracement).
The RSI is above the 50 levels to show the established bullish momentum. This support the bullish option, as of writing these lines.
ETH/BTC – Rebounds From 0.0185 BTC Support To Return To 100-Days EMA
Against Bitcoin, Ethereum rebounded from the .382 Fibonacci Retracement support to rise into the 100-days EMA resistance at around 0.0195 BTC. The cryptocurrency has been struggling with this resistance throughout January and has established another month-long ascending triangle pattern.
Ethereum remains neutral against BTC as it trades in consolidation. To turn bullish, it must break above the triangle. A drop beneath the triangle would turn it neutral with a further drop beneath 0.018 BTC turning it short-term bearish.
Ethereum Short Term Price Prediction
If the buyers bring ETH above the triangle, resistance lies at 0.02 BTC. Above this, 0.0204 BTC and 0.021 BTC will provide substantial additional resistance.
Alternatively, beneath 0.0191 BTC support lies at 0.0185 BTC, 0.0182 BTC, and 0.0179 BTC.
The RSI is slightly above the 50 levels to show weak bullish momentum. To break the triangle, the RSI must continue to grind higher. Additionally, the Stochastic RSI produced a bullish crossover signal recently to help push the coin higher against BTC.
Disclaimer: Information found on CryptoPotato is those of writers quoted. It does not represent the opinions of CryptoPotato on whether to buy, sell, or hold any investments. You are advised to conduct your own research before making any investment decisions. Use provided information at your own risk. See Disclaimer for more information.
The post appeared first on CryptoPotato


