
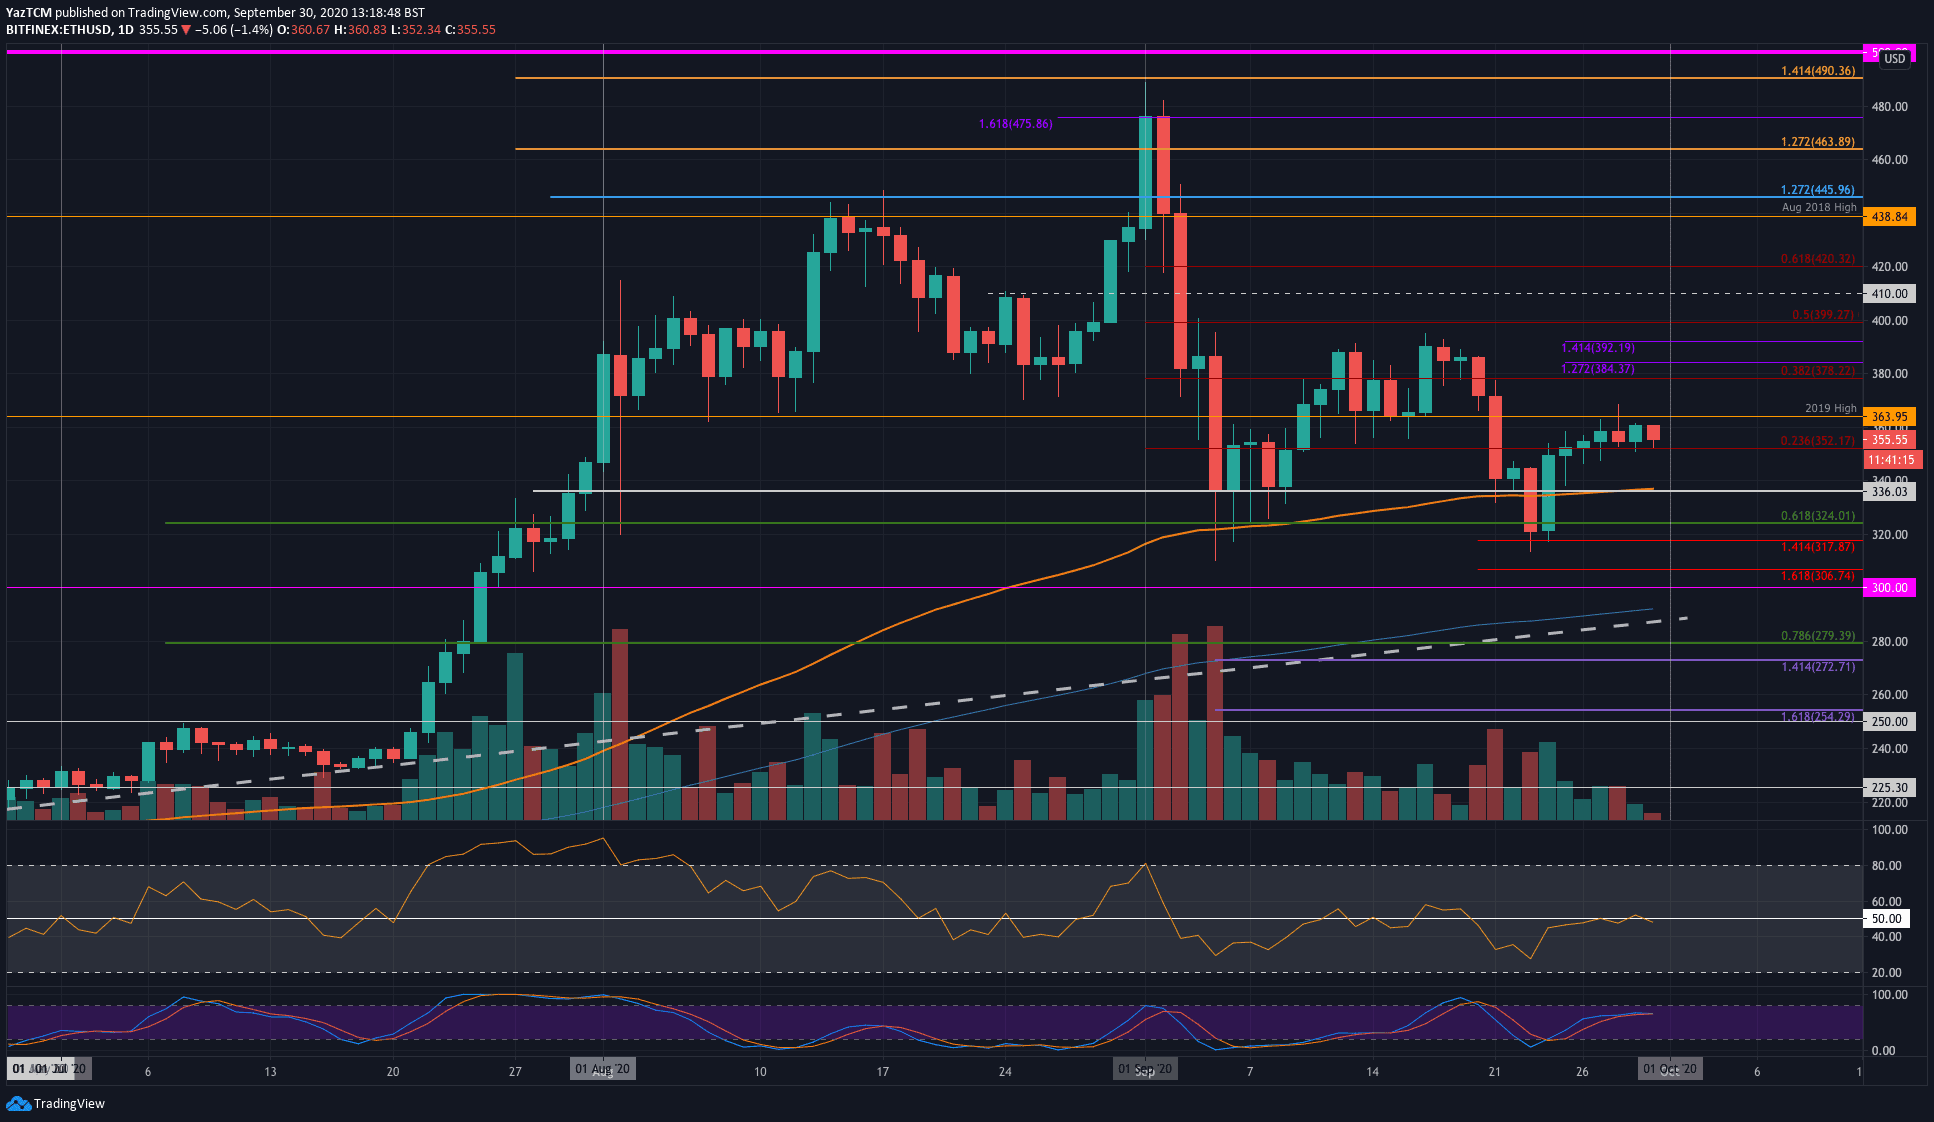
ETH/USD – Bulls Struggling To Pass 2019 Highs
Key Support Levels: $350, $336, $325.
Key Resistance Levels: $364, $378, $390.
Ethereum pushed higher last week to reach the 2019 highs at around $364 over the weekend. Unfortunately, it has not been able to overcome this resistance in the past four days of trading as bearish divergence popped up on the short term charts – highlighted in our last analysis.
For now, Ethereum is finding strong support between $350 and $355; however, it is looking increasingly likely to break this support soon as the short-term bearish divergence continues to play out.
ETH-USD Short Term Price Prediction
If ETH does penetrate back beneath $350, the first level of strong support lies at $336 (100-days EMA). Beneath this, additional support lies at $324 (.618 Fib), $320, $310, and $300.
On the other side, the first level of resistance lies at $364 (2019 highs). Above this, resistance is expected at $378 (bearish .382 Fib), $390, and $400.
The Daily RSI did dip beneath the mid-line to suggest that the sellers are battling to gain control of the market momentum.
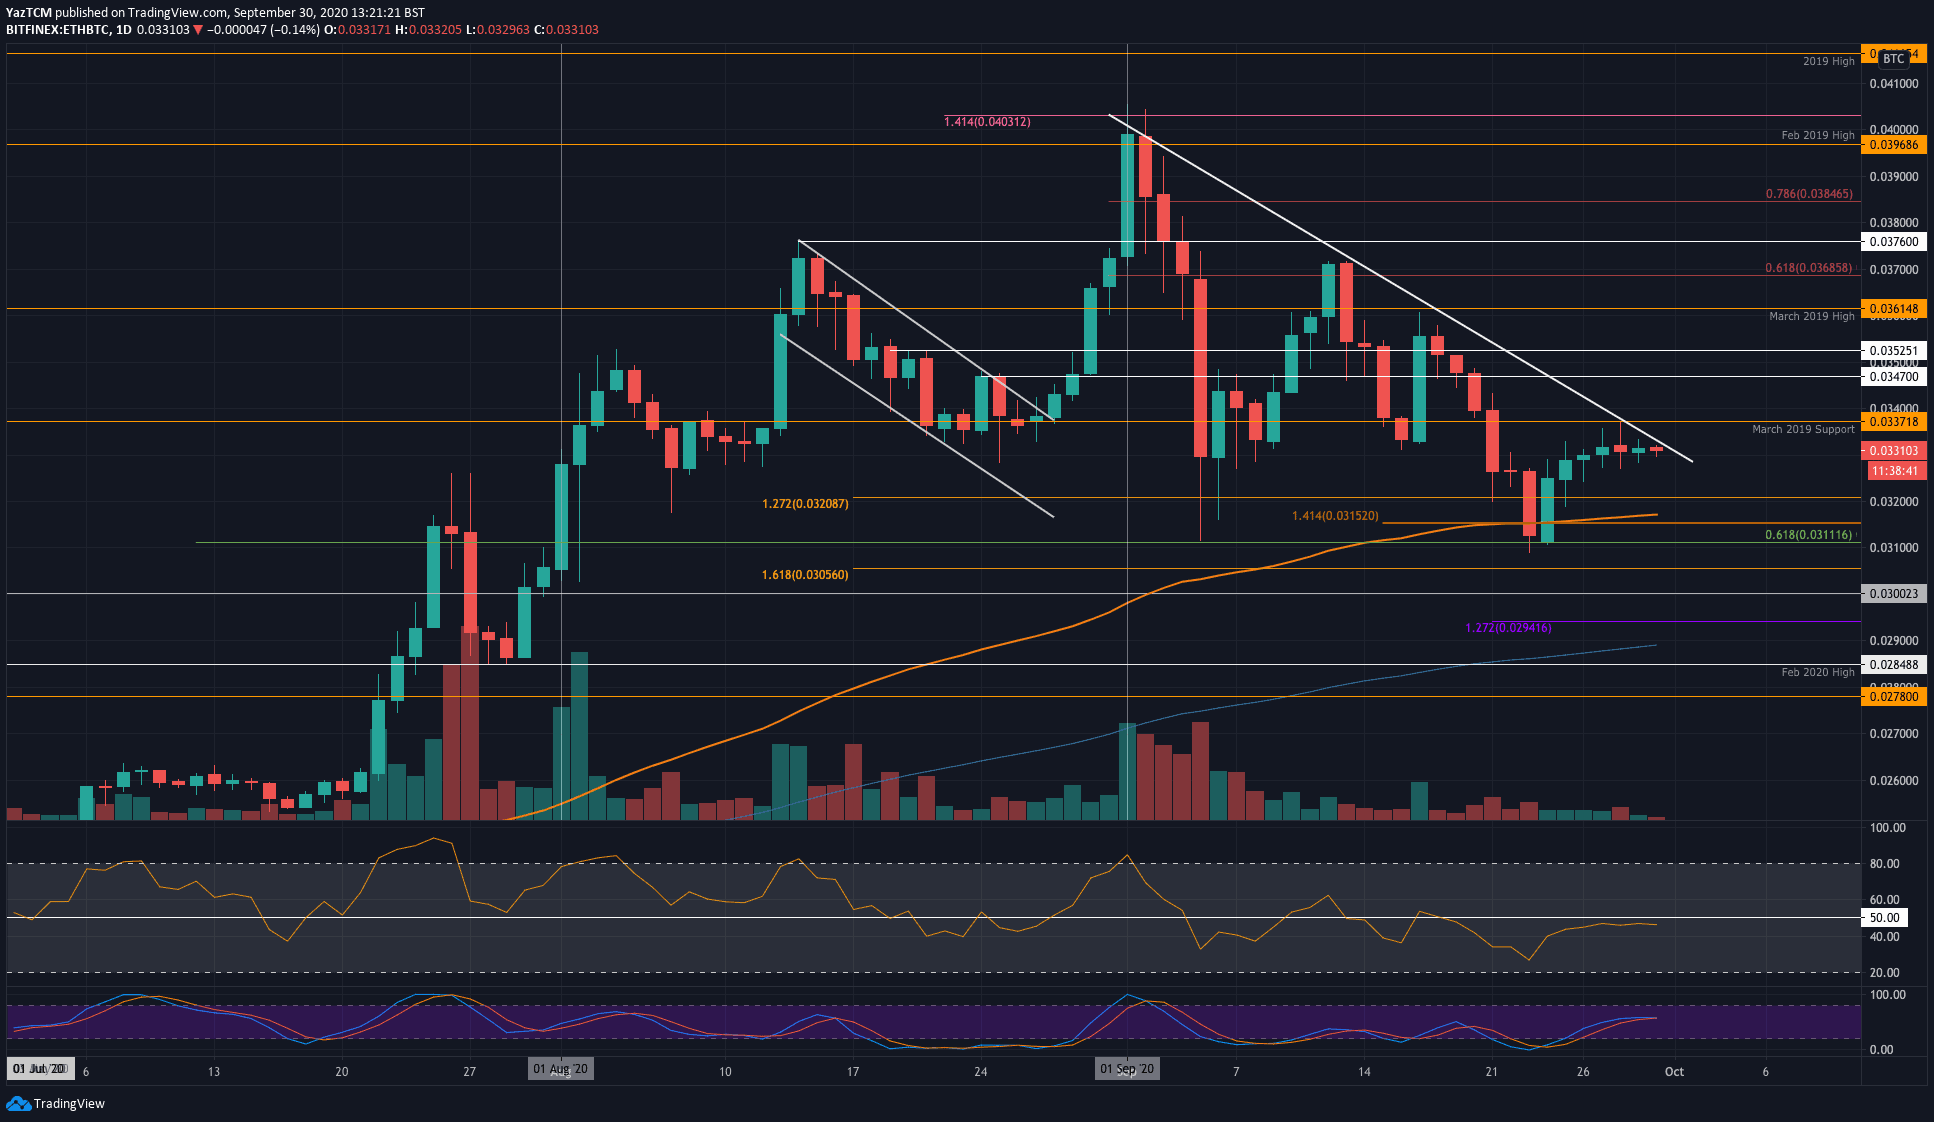
ETH/BTC – Bears Continue To Face Resistance at Falling Trend Line
Key Support Levels: 0.033BTC, 0.032 BTC, 0.0315 BTC.
Key Resistance Levels: 0.0337 BTC, 0.0347 BTC, 0.0352 BTC.
Against Bitcoin, Ethereum continues to face the resistance at a falling trend line that has dictated price action during September. Each time ETH attempted to break above this falling trend line, the coin was rejected and headed lower.
On Monday, ETH attempted to push beyond the March 2019 support at 0.0337 BTC but could not pass it. As a result, ETH moved sideways this week and has returned to the falling trend line. Here, it can be expected that ETH should be heading lower – especially with the daily RSI flattening out in the bearish territory.
ETH-BTC Short Term Price Prediction
Looking ahead, if the trend line rejects the sellers, the first two levels of support lie at 0.033 BTC and 0.032 BTC. Beneath this, support lies at 0.0315 BTC (100-days EMA & downside 1.414 Fib Extension), 0.0311 BTC (.618 Fib Retracement), and 0.0305 BTC.
On the other side, if the bulls can penetrate the falling trend line, the first level of resistance lies at 0.0337 BTC (March 2019 Support). Above this, resistance lies at 0.0347 BTC, 0.0352 BTC, and 0.0361 BTC (March 2019 High).
Click here to start trading on BitMEX and receive 10% discount on fees for 6 months.
Disclaimer: Information found on CryptoPotato is those of writers quoted. It does not represent the opinions of CryptoPotato on whether to buy, sell, or hold any investments. You are advised to conduct your own research before making any investment decisions. Use provided information at your own risk. See Disclaimer for more information.
The post appeared first on CryptoPotato


