
ETH price failed to stay above the key $185 and $180 support levels against the US Dollar.The price is down around 10% and is trading below $172, while bitcoin is down around 5%.There was a break below a bearish continuation pattern with support near $172 on the hourly chart of ETH/USD (data feed via Kraken).The pair is likely to continue lower and it may soon test the $165 or $162 support.Ethereum price is down close to 10% versus the US Dollar, with strong bearish moves vs bitcoin. ETH price remains in a downtrend and it could decline further to $162.Ethereum Price AnalysisIn the past few days, we saw how ETH price struggled to clear the $192 and $195 resistance against the US Dollar. The price even settled below the $190 support and the 100 hourly simple moving average. As a result, there was a sharp decline below the $185 and $180 support levels. The price declined around 10% and even broke the $172 support area. Similarly, there were strong bearish moves in bitcoin, ripple, EOS, and binance coin.A new monthly low was formed near $166 before Ethereum started an upside correction. It recovered above the $170 level plus the 23.6% Fib retracement level of the recent drop from the $188 swing high to $166 swing low. However, the upward move was capped by the $174-175 zone. Moreover, the price failed to test the 50% Fib retracement level of the recent drop from the $188 swing high to $166 swing low.Recently, there was a break below a bearish continuation pattern with support near $172 on the hourly chart of ETH/USD. The pair is now trading near the $170 level and it seems like it could continue to move down. An immediate support is near the $166 and $165 levels. However, the main target for the bears could be near the $162 level in the near term.On the upside, there are many hurdles near the $175 level. However, the main resistance is now near the $180 and $182 levels (the previous supports). Besides, the 61.8% Fib retracement level of the recent drop from the $188 swing high to $166 swing low is also near the $180 level.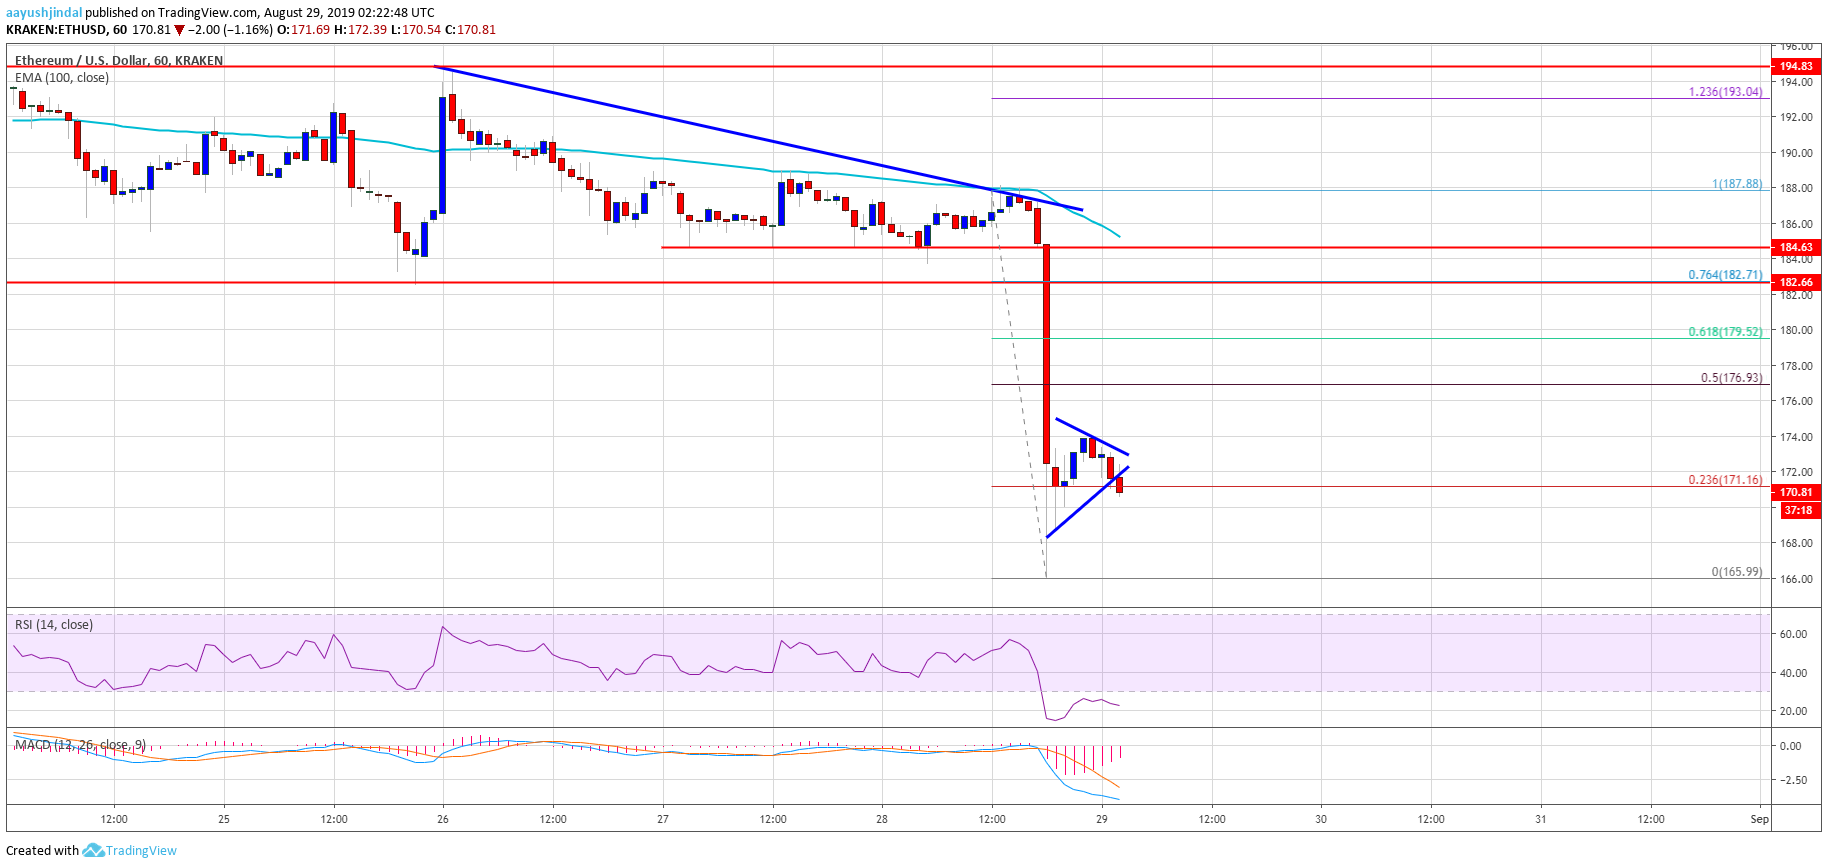 Looking at the chart, Ethereum price is clearly facing a strong resistance near the $172 and $175 levels. Therefore, it might continue to move down below the $170 and $166 levels.ETH Technical IndicatorsHourly MACD – The MACD for ETH/USD is slowly reducing its recent bearish slope.Hourly RSI – The RSI for ETH/USD is still in the extreme oversold area, with bearish signs.Major Support Level – $165Major Resistance Level – $175The post appeared first on NewsBTC


