
ETH price recovered recently and managed to climb above the $190 resistance against the US Dollar.The price is now trading nicely above the $190 and $192 resistance levels.There is a connecting bullish trend line forming with support near $188 on the hourly chart of ETH/USD (data feed via Kraken).The pair is likely to continue higher, but the $202 resistance is likely to cap the upside.Ethereum price is climbing higher towards key resistances versus the US Dollar, similar to bitcoin. ETH price is likely to face a strong selling interest near the $200 level.Ethereum Price AnalysisThis past week, we saw a major drop in ETH price below the $202 support area against the US Dollar. The decline was such that the price even broke the $184 support area. Finally, it traded to a new monthly low at $174 and recently started an upside correction. Besides, there was a decent recovery noted in bitcoin price as well above the $10,200 resistance level.Ethereum price recovered above the key $190 resistance level and the 100 hourly simple moving average. Moreover, there was a break above the $192 and $195 resistance levels. It tested the $198 level and is currently consolidating gains. It tested the 23.6% Fib retracement level of the upward move from the $184 swing low to $198 high. On the downside, there is a strong support forming near the $190 level and the 100 hourly SMA.Moreover, there is a connecting bullish trend line forming with support near $188 on the hourly chart of ETH/USD. The $190 support also coincides with the 50% Fib retracement level of the upward move from the $184 swing low to $198 high. Therefore, dips towards the $190 support area might find buyers in the short term. If there is a downside break below $190 and $188, the price could resume its decline.On the upside, there is a strong resistance area near the $200 and $202 levels. Therefore,. if there is an upside break above the $202 resistance, the price is likely to continue higher towards the $210 and $215 levels.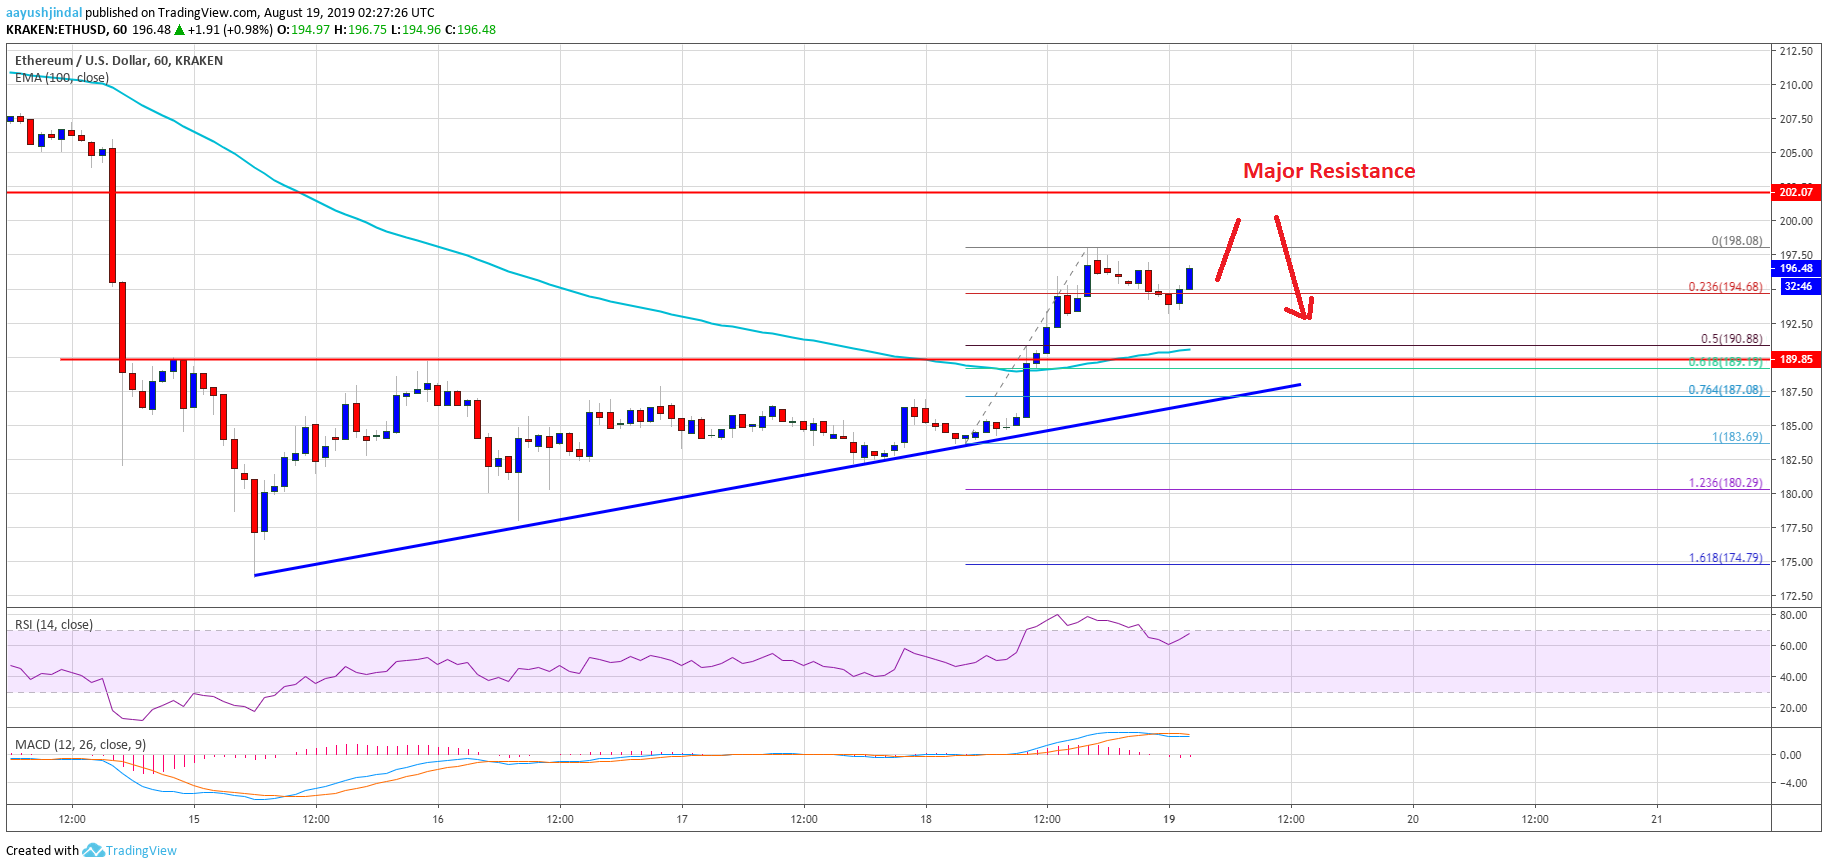 Looking at the chart, Ethereum price is clearly correcting higher and is trading nicely above the $192 level. Having said that, the $202 resistance area holds the key. If the price fails to surpass the $202 barrier, there could be a fresh decline. The main supports on the downside are near the $190 and $188 levels.ETH Technical IndicatorsHourly MACD – The MACD for ETH/USD is slowly moving into the bearish zone.Hourly RSI – The RSI for ETH/USD is currently placed nicely above the 60 level.Major Support Level – $190Major Resistance Level – $202The post appeared first on NewsBTC


