
- Ethereum surged by a total of around 20% over the past two weeks, but it struggles to break $250.
- The cryptocurrency has been trading between $235 and $250 for the entire period of June.
- Against Bitcoin, Ethereum struggles to pass the resistance at 0.0253 BTC.
Key Support & Resistance Levels
ETH/USD:
Support: $240, $235, $225.
Resistance: $250, $254, $268.
ETH/BTC:
Support: 0.025 BTC, 0.0243 BTC, 0.024 BTC.
Resistance: 0.0255 BTC, 0.026 BTC, 0.0265 BTC.
ETH/USD: Ethereum Continues To Battle At $250.
Ethereum surged by 20% over the past fortnight after it climbed from $200 to reach $250. However, since then, ETH has struggled to continue higher. The cryptocurrency ended May by breaking above $215, which allowed it to surge above the previous consolidation pattern and head toward $250.
In June, ETH has pretty much traded sideways between $235 and $250 and must break this short term range to dictate the next direction.

ETH-USD Short Term Price Prediction
Looking ahead, once the buyers break above $250, the first level of resistance lies at $254. Above this, resistance lies at $258 (bearish .618 Fib Retracement), $268, and $275.
On the other side, if the sellers push beneath $240, support lies at $235, $225, and $215. Beneath this, added support is found at $210 and $200.
The RSI is above 50 but is falling quickly to indicate fading bullish momentum. For a break above $250, the RSI must push higher to show increasing bullish momentum within the market.
ETH/BTC: ETH Buyers Struggle To Pass 0.0253 BTC
Against Bitcoin, Ethereum penetrated above a symmetrical triangle pattern last week as it broke above 0.025 BTC. However, since then, ETH has struggled to overcome the resistance at 0.0255 BTC.
ETH failed to push beyond this resistance on every attempt during June 2020.
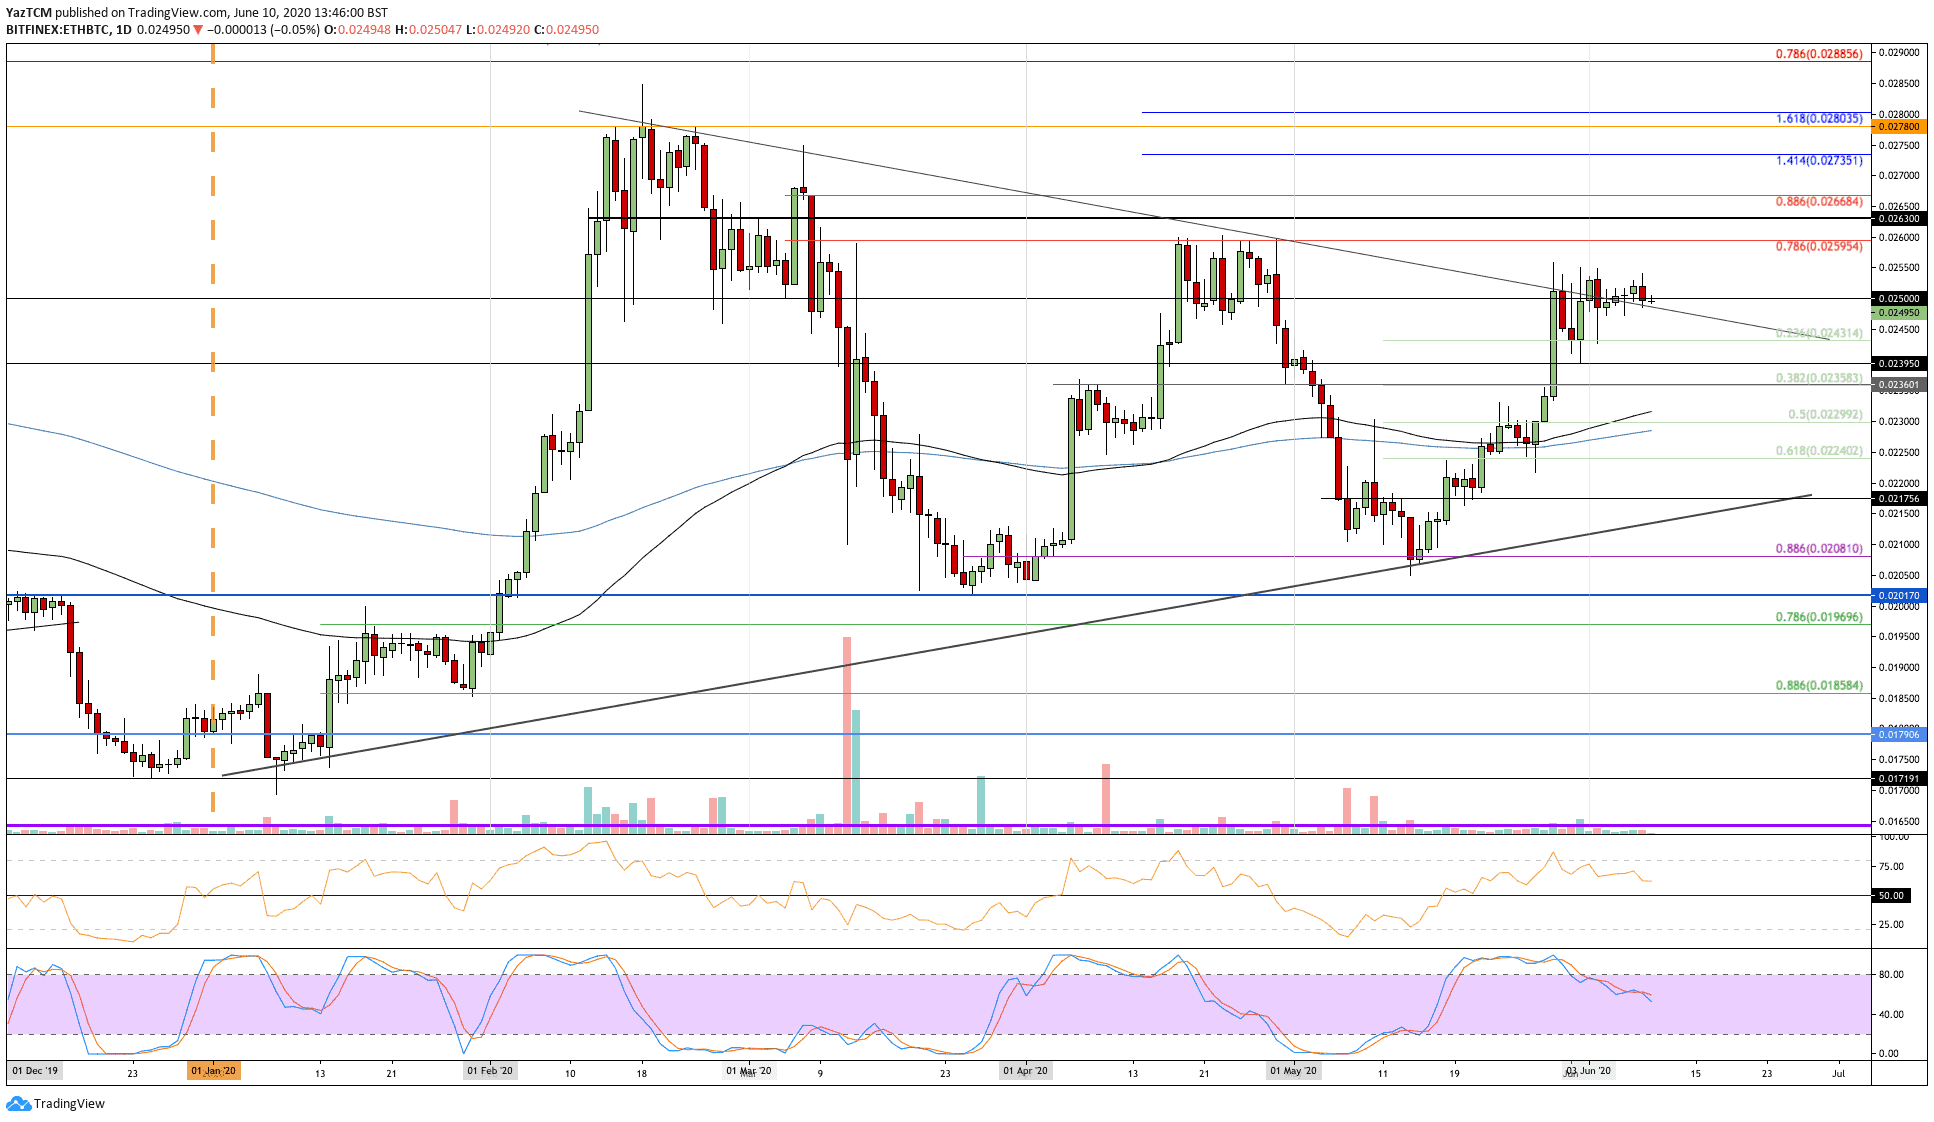
ETH-BTC Short Term Price Prediction
Once the buyers break, 0.0255 BTC resistance is then located at 0.026 BTC. Above this, resistance is found at 0.0265 BTC, 0.0268 BTC, and 0.027 BTC.
On the other side, the first level of support lies at 0.025 BTC. Beneath this, support is found at 0.0243 BTC (.236 Fib Retracement), 0.024 BTC, and 0.0236 BTC (.382 Fib Retracement).
The RSI is also above the 50 line but is falling to indicate fading bullish momentum.
The post Ethereum Price Sideways Action Around $250: The Calm Before The Storm? ETH Analysis & Overview appeared first on CryptoPotato.
The post appeared first on CryptoPotato


