
Ethereum is struggling to stay above the key $125 support area against the US Dollar.A successful close below $125 could spark another bearish wave in the near term.There is a connecting bearish trend line forming with resistance near $130 on the hourly chart of ETH/USD (data feed via Kraken).Bitcoin is currently consolidating above the $7,200 support area.Ethereum price is showing a few bearish signs versus the US Dollar and bitcoin. ETH price could decline heavily if there is a break below $125 and $120.Ethereum Price AnalysisYesterday, there was the start of a downside correction in Ethereum price from the $135 resistance against the US Dollar. Moreover, ETH price settled below the $130 support and the 100 hourly simple moving average.It opened the doors for more losses and the price traded below $128. Recently, there was a break below a contracting triangle with support near $127 on the hourly chart of ETH/USD.As a result, the price seems to be struggling to stay above the key $125 support area. If there is a successful close below the $125 support, the price could continue to move down. The next support is near the $120 level, below which the bears are likely to gain momentum and they might aim $115.On the upside, Ethereum is facing hurdles near the $130 area and the 100 hourly simple moving average. An initial resistance is near the 50% Fib retracement level of the recent decline from the $130 high to $125 low.Besides, there is a connecting bearish trend line forming with resistance near $130 on the same chart. An intermediate resistance is near the 76.4% Fib retracement level of the recent decline from the $130 high to $125 low.Therefore, a successful close above the $130 resistance and the trend line is needed for a fresh increase. In the mentioned case, the price could revisit the $135 resistance area.On the other hand, the price could struggle to recover above $130 and the 100 hourly SMA. Additionally, a break below the $125 support may perhaps put the bears in full control in the short term.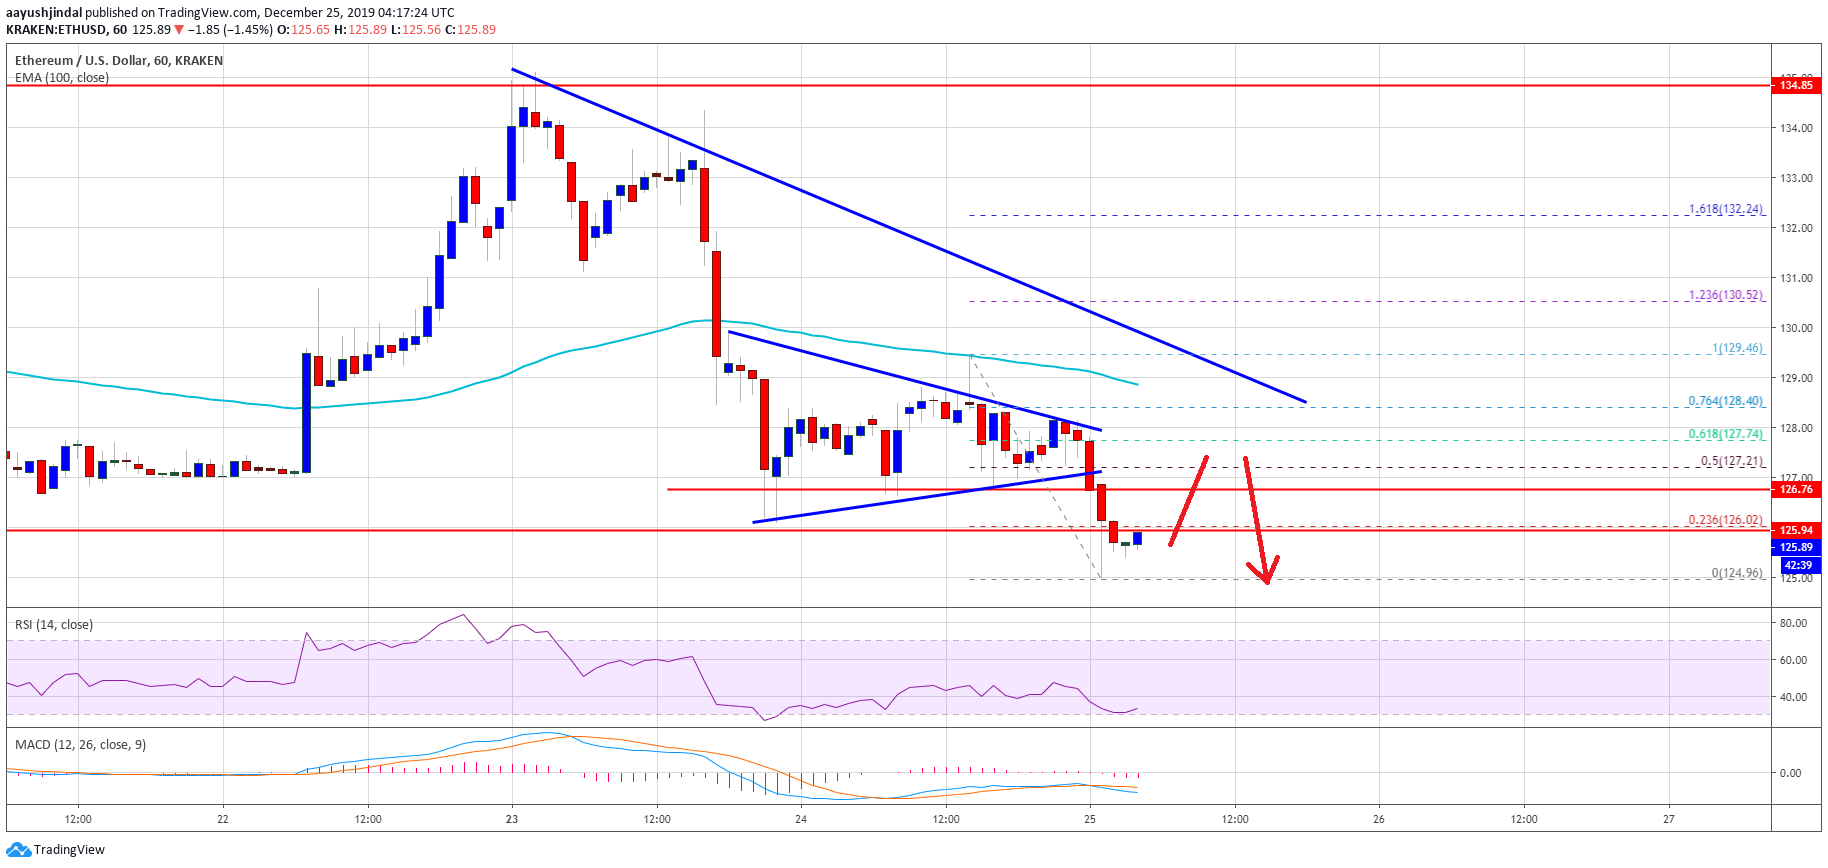 Ethereum PriceLooking at the chart, Ethereum price is showing a few bearish signs below the $130 resistance area. Thus, the price remains at a risk of more downsides below $125 unless it surges above $128 and $130.ETH Technical IndicatorsHourly MACD – The MACD for ETH/USD is slowly gaining pace in the bearish zone.Hourly RSI – The RSI for ETH/USD is now near the 30 level, with a minor bullish angle.Major Support Level – $125Major Resistance Level – $130The post appeared first on NewsBTC


