
Ethereum faced a massive slump on 14th August; the virtual asset witnessed a major drop of over 13 percent at that time of period which took ETH’s valuation below $200 dollar for the first time in a month.
Ethereum continued to dwell under the $200 region following the fall.
12-hour chart
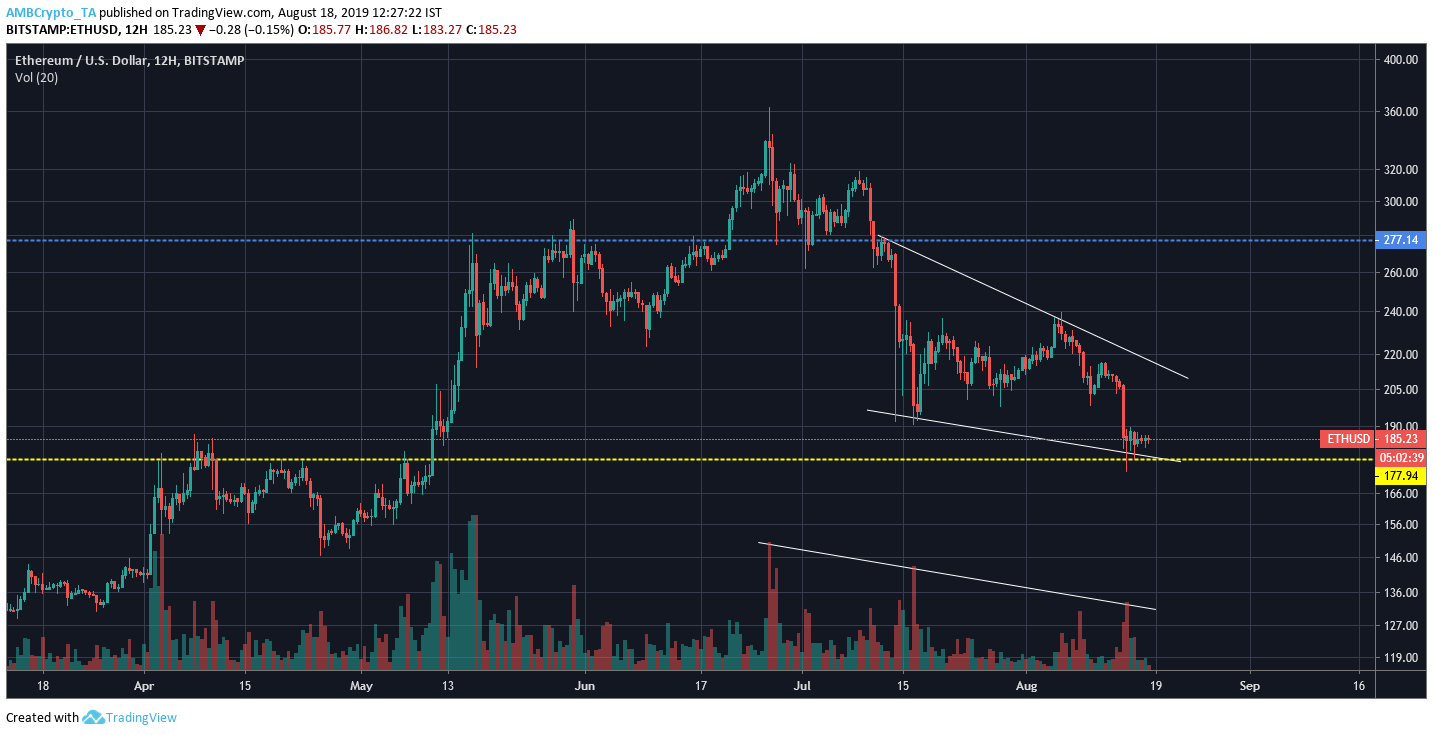
Source: Trading View
After carefully observing the 12-hour chart, it was clear that Ethereum was gradually losing valuation for over a month at press time. However, the price movement of Ethereum formed a falling wedge with its current activity. A couple of lower highs were formed in the channel, indicating that the price had adhered to the pattern.
Ethereum has immediate support at $177.94 but according to the trend, there seems to be a higher possibility that the price might go lower before eventually rising to test resistance at $277.14. The descending volume also confirmed validity of the falling wedge, indicating absence of investors at the moment.
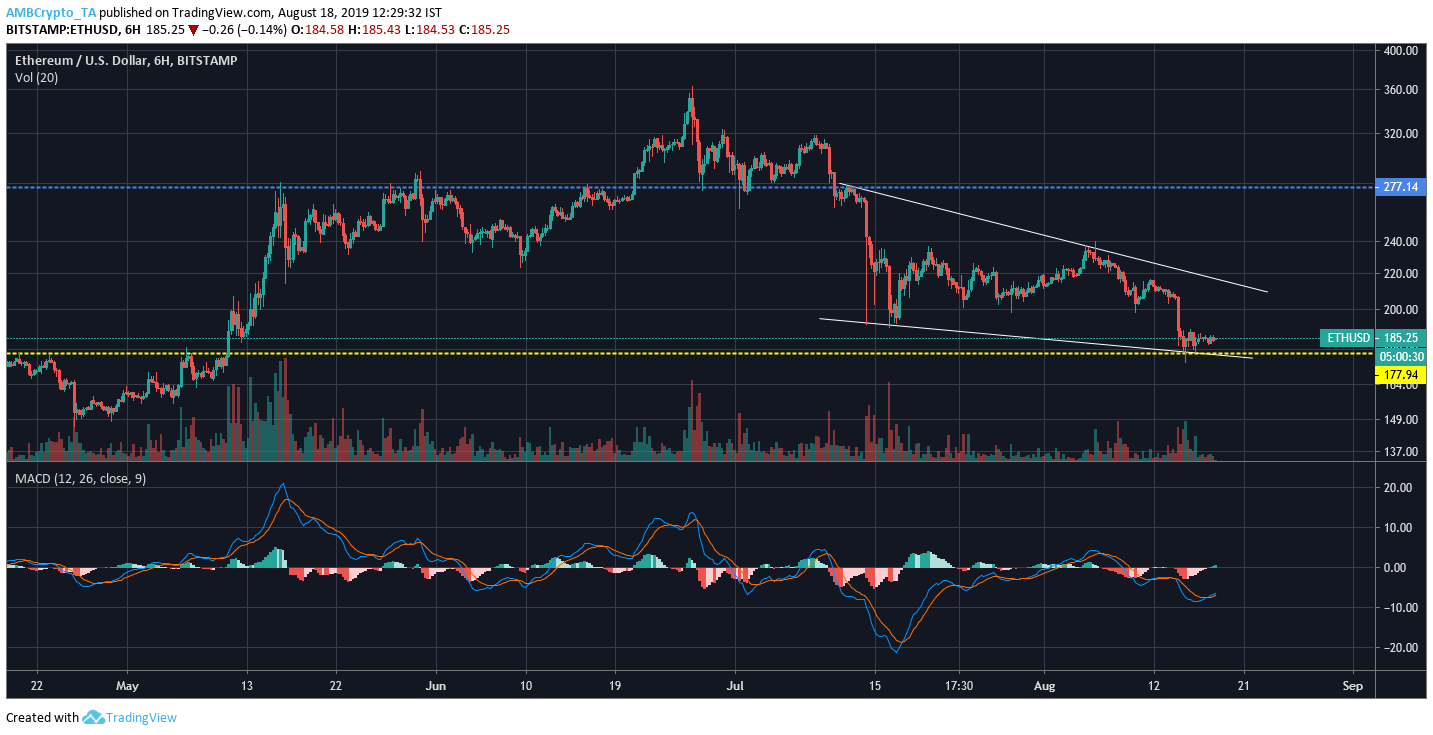
Source: Trading View
The 6-hour chart of Ethereum resonated a similar falling wedge formation with respect to the 12-hour chart. The MACD indicator suggested another positive sign for Ethereum as the MACD line completed a bullish crossover with the signal line.
At press time, Ethereum was valued $184.30 and the market cap remains just under the $20 billion mark.
The post appeared first on AMBCrypto


