
ETH/USD – Ethereum Struggles To Break Above $456 Resistance
Key Support Levels: $438, $430, $421.
Key Resistance Levels: $456, $462.50, $475
Last Friday, Ethereum surged to $456 where it met the resistance at the upper boundary of a rising price channel. It failed to close a daily candle above this level as it moved sideways between $456 and $435 over the weekend.
Yesterday, Ethereum failed to close the daily candle above $456. The coin found support today at the $438 level (August 2018 highs) as it continues to battle to break above the resistance at $456.
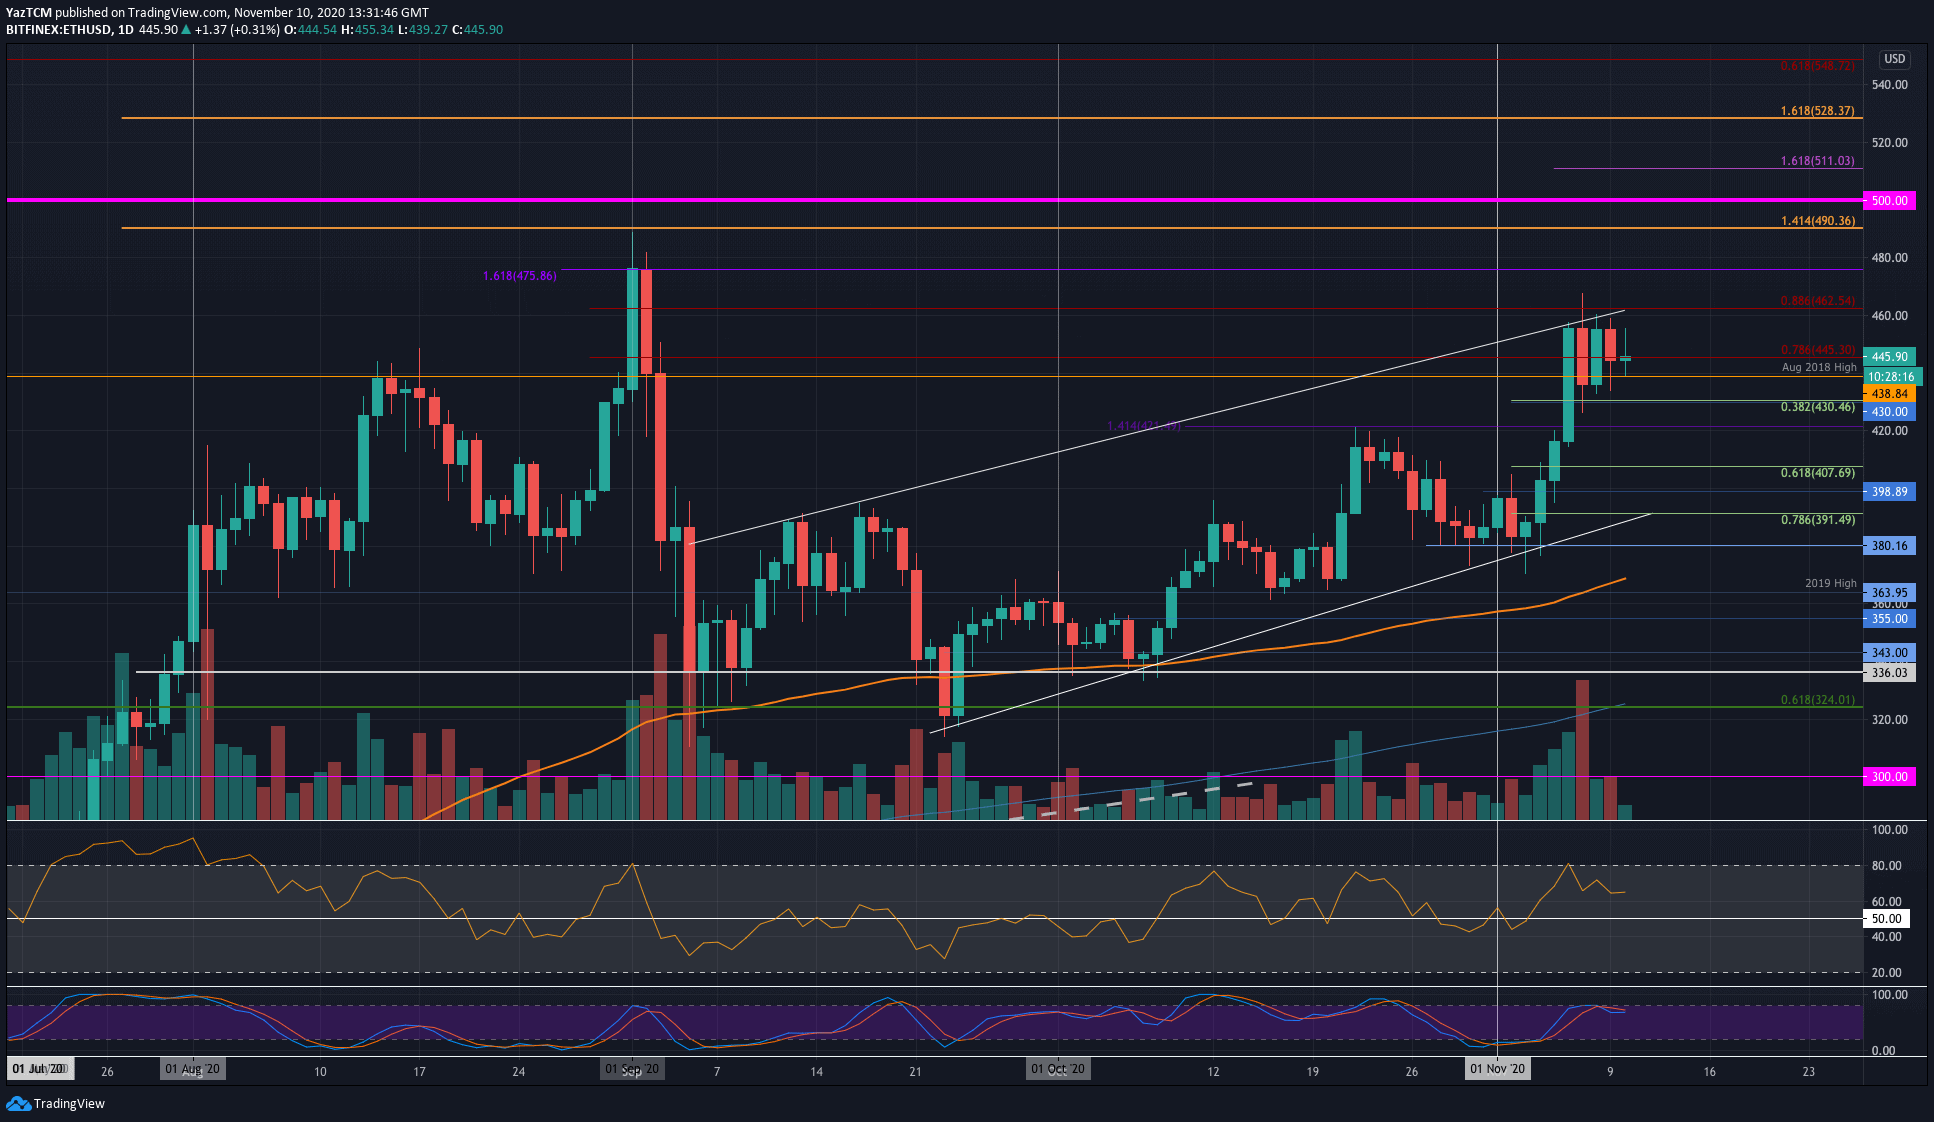
ETH-USD Short Term Price Prediction
Looking ahead, if the buyers can break $456, the first level of resistance lies at $462 (bearish .886 Fib Retracement). Following this, resistance lies at $475 (September high-day closing price), $490 (1.414 Fib Extension), and $500.
On the other side, the first level of support lies at $438 (August 2018 Highs). Beneath this, support lies at $430 (.382 Fib), $421, and $407 (.618 Fib).
The Stochastic RSI is primed for a bearish crossover signal which could suggest that the buyers might not be able to break the $456 resistance. Despite this, the RSI remains above the mid-line to indicate the bulls are still in control of the market momentum.
ETH/BTC – Bulls Battle With 200-days EMA continues
Key Support Levels: 0.029 BTC, 0.0284 BTC, 0.0278 BTC.
Key Resistance Levels: 0.0295 BTC, 0.03 BTC, 0.0305 BTC.
Against Bitcoin, Ethereum found support at the 0.0267 BTC level (downside 1.272 FIb Extension) toward the end of last week which allowed the coin to rebound higher.
After reversing, ETH surged higher to reach the resistance at 0.0295 BTC at the 200-days EMA. The bulls have been unable to break the resistance at the 200-days EMA since Friday and the market has moved sideways between the 200-days EMA and the support at 0.029 BTC.
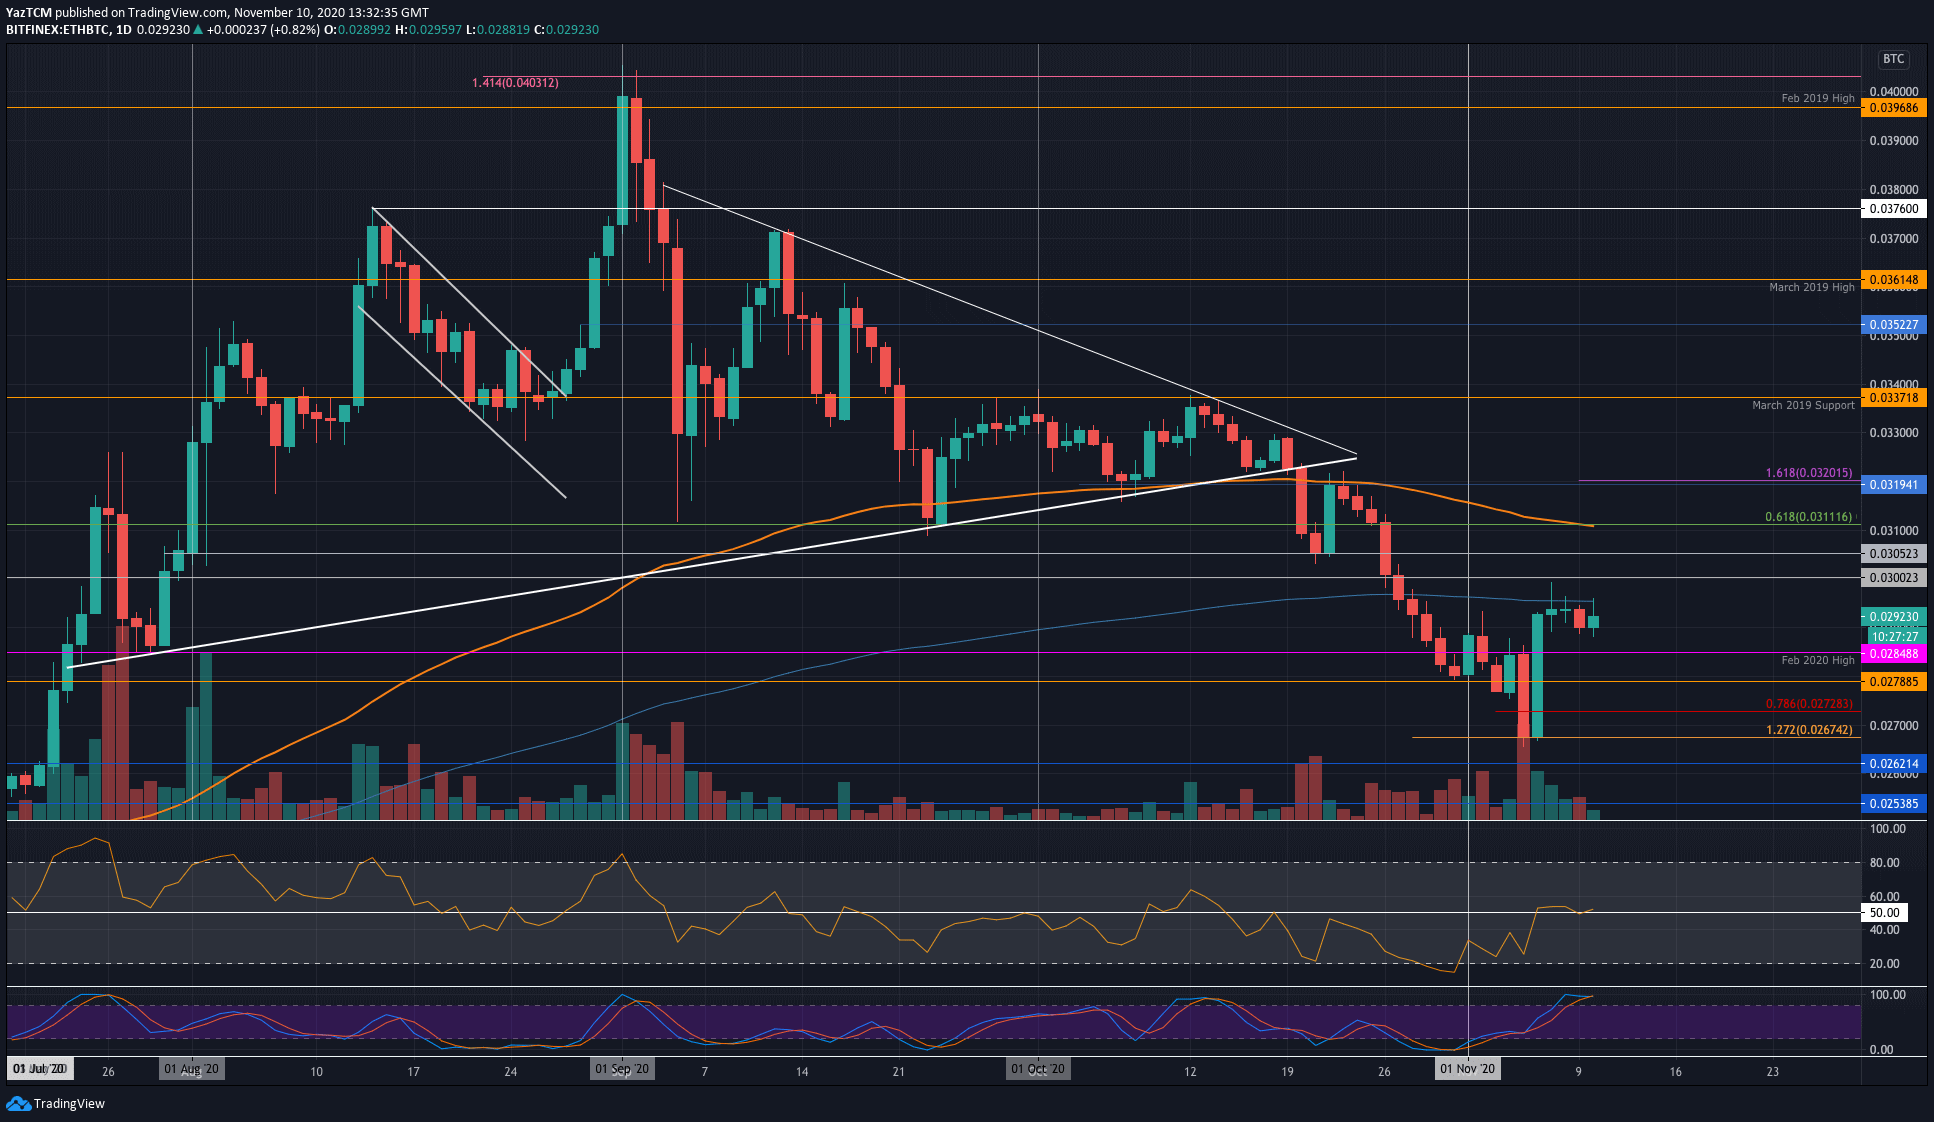
ETH-BTC Short Term Price Prediction
Looking ahead, the buyers can break the 200-days EMA, the first level of resistance lies at 0.03 BTC. Above this, resistance lies at 0.0305 BTC, 0.0311 BTC (100-days EMA), and 0.032 BTC.
On the other side, the first level of support lies at 0.029 BTC. Beneath this, support lies at 0.0284 BTC (Feb 2020 Highs), 0.0278 BTC, and 0.0272 BTC.
The RSI is at the mid-line to indicate indecision within the market. However, the RSI is edging above the mid-line to show the buyers are battling to gain control of the market momentum. However, the Stochastic RSI is primed for a bearish crossover signal that could send the market lower.
Binance Futures 50 USDT FREE Voucher: Use this link to register & get 10% off fees and 50 USDT when trading 500 USDT (limited offer).
Disclaimer: Information found on CryptoPotato is those of writers quoted. It does not represent the opinions of CryptoPotato on whether to buy, sell, or hold any investments. You are advised to conduct your own research before making any investment decisions. Use provided information at your own risk. See Disclaimer for more information.
The post appeared first on CryptoPotato


 Options Markets: Kaiko")

