
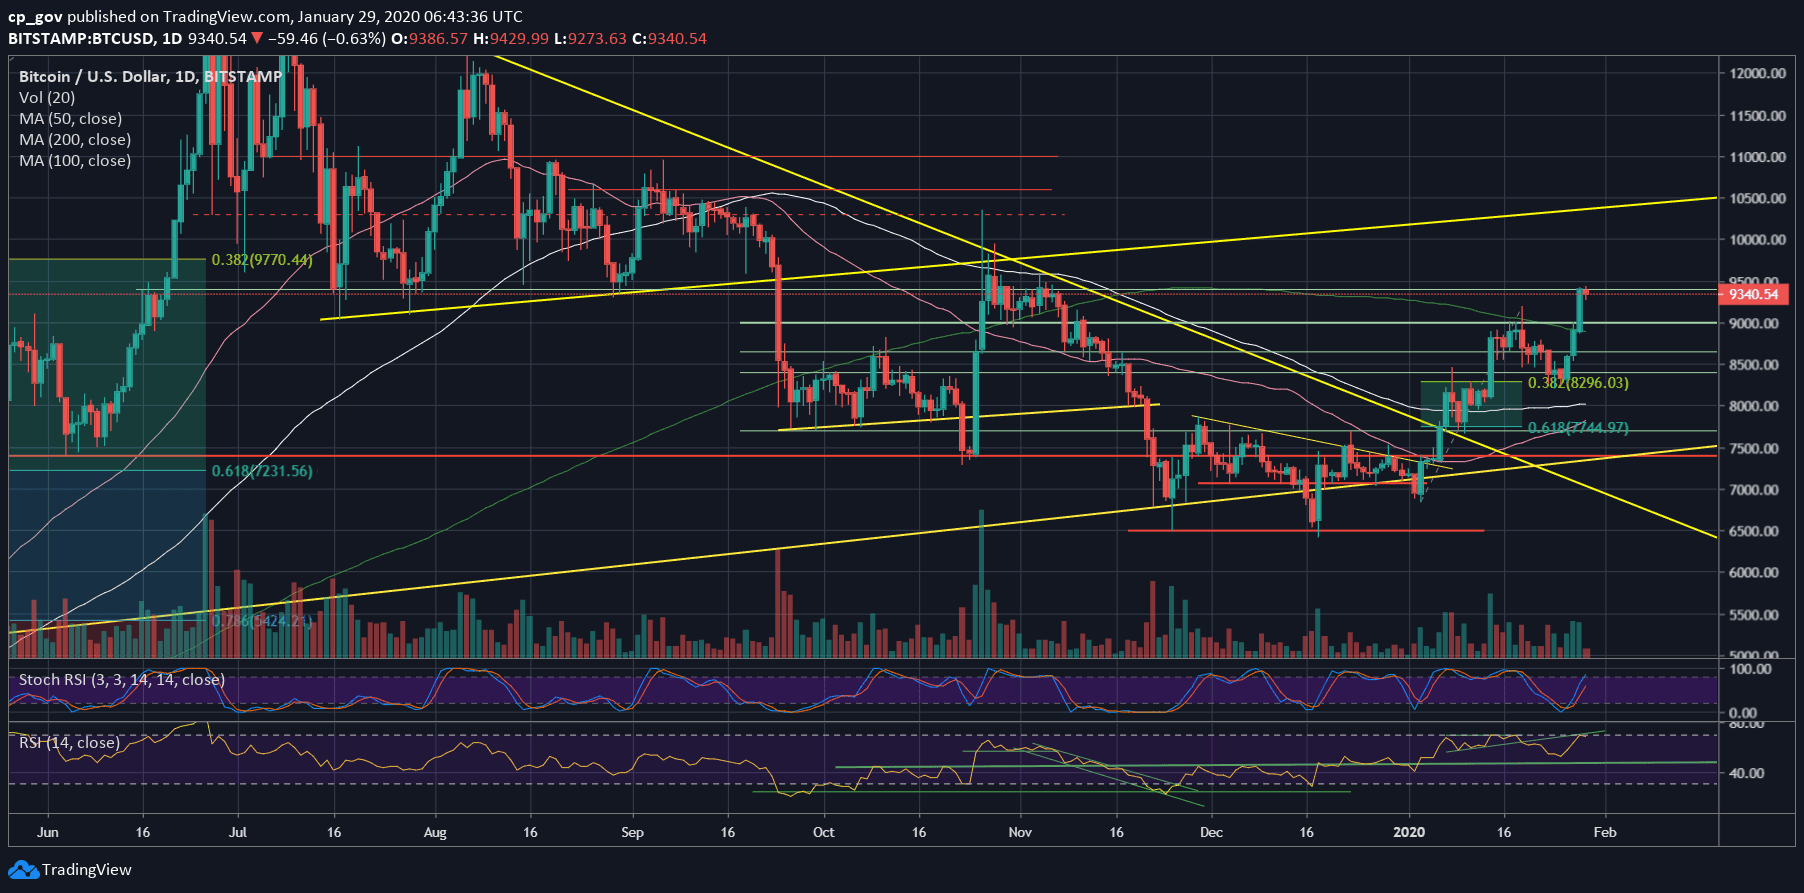
Over the past days, following a decent start to the new decade, we had seen Bitcoin correcting nicely and healthily into the 38.2% Fibonacci level at $8300.
Immediately after that, Bitcoin fired its engines and in just three consecutive days, the primary cryptocurrency had gained over $1200 (!), which is more than 15% to its value.
Surprisingly, the altcoins are not crashing. Thus, we can conclude that new money is getting into the market and not changing hands, from Altcoins to Bitcoin and vice versa.
Why Bitcoin Is Rising?
This time, the trigger could be the panic surrounding the elaborating Chinese financial crisis following the spreading Coronavirus.
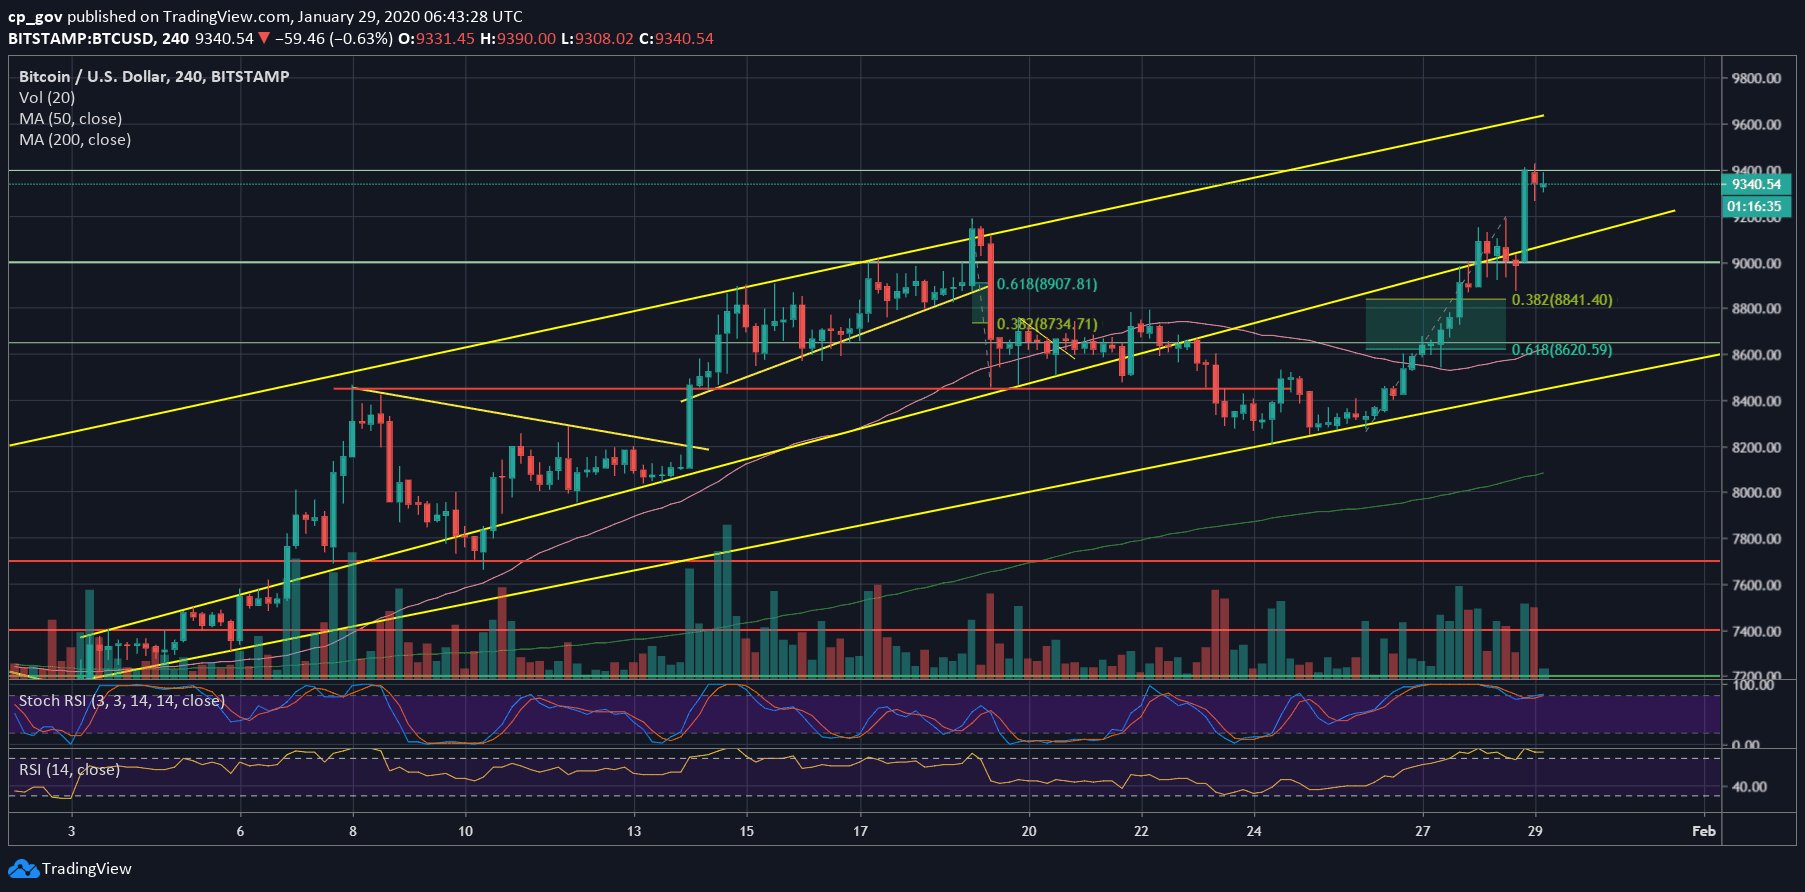
Looking at the charts, we can see that Bitcoin price had reached the $9400 resistance line accurately a few hours ago, and since then, we are seeing the price consolidating around it.
As of now, Bitcoin leaves behind the significant 200-days moving average line (currently around $8900), and it looks like this rally can quickly become the first parabolic race of 2020 – if it’s not already. However, always keep in mind that violent moves are meant to both directions, hence, if a correction comes it could be violent.
The crypto community is excited these days; however, the mass-media and the majority are not yet here, which in someplace is a positive sign for Bitcoin. Maybe this will happen once Bitcoin price crosses $10,000? Who knows.
Total Market Cap: $257 billion
Bitcoin Market Cap: $170 billion
BTC Dominance Index: 66.2%
*Data by CoinGecko
Key Levels To Watch & Next Targets
– Support/Resistance levels: After breaking above the $9000 mark a few hours ago, Bitcoin quickly elevated till the next mentioned resistance at $9400. The last is currently the first major level of resistance.
In case of a Bullish breakout, we can expect Bitcoin to visit the good-old resistance from the daily chart at $9550, before the top boundary of our marked ascending price channel on the following 4-hour chart (roughly around $9700 as of writing these lines). The $9700 – $9800 is considered a strong demand line. Further above lies $10,000 and $10,300.
In the likely event of a correction, then the recent high of $9200, can serve as the first level of support, together with the middle ascending trend-line on the 4-hour chart. Below lies $8900 – $9000, along with the 200-days MA line. Further below is $8650.
– The RSI Indicator: At this point, there is a little bearish divergence developing on the RSI. The indicator is encountering a significant ascending trend-line resistance. To go higher, the RSI will need to get over the 71-72 levels.
As we mentioned here two days ago, the Stochastic RSI oscillator did predict this bullish move of the past two days. In respect to the bulls, there is still room to go higher, looking on the oscillator.
– Trading volume: The volume is also supporting the rising trend. Over the past days, we are seeing an increasing amount of volume from day to day; the price rally is real.
BTC/USD BitStamp 4-Hour Chart
BTC/USD BitStamp 1-Day Chart
Disclaimer: Information found on CryptoPotato is those of writers quoted. It does not represent the opinions of CryptoPotato on whether to buy, sell, or hold any investments. You are advised to conduct your own research before making any investment decisions. Use provided information at your own risk. See Disclaimer for more information.
The post appeared first on CryptoPotato


