
After three days of no significant price movements, Bitcoin is now planning its next leg. As we know this market, Bitcoin doesn’t like being low in volatility, and this might be the preparation period of another move that can take place any moment.
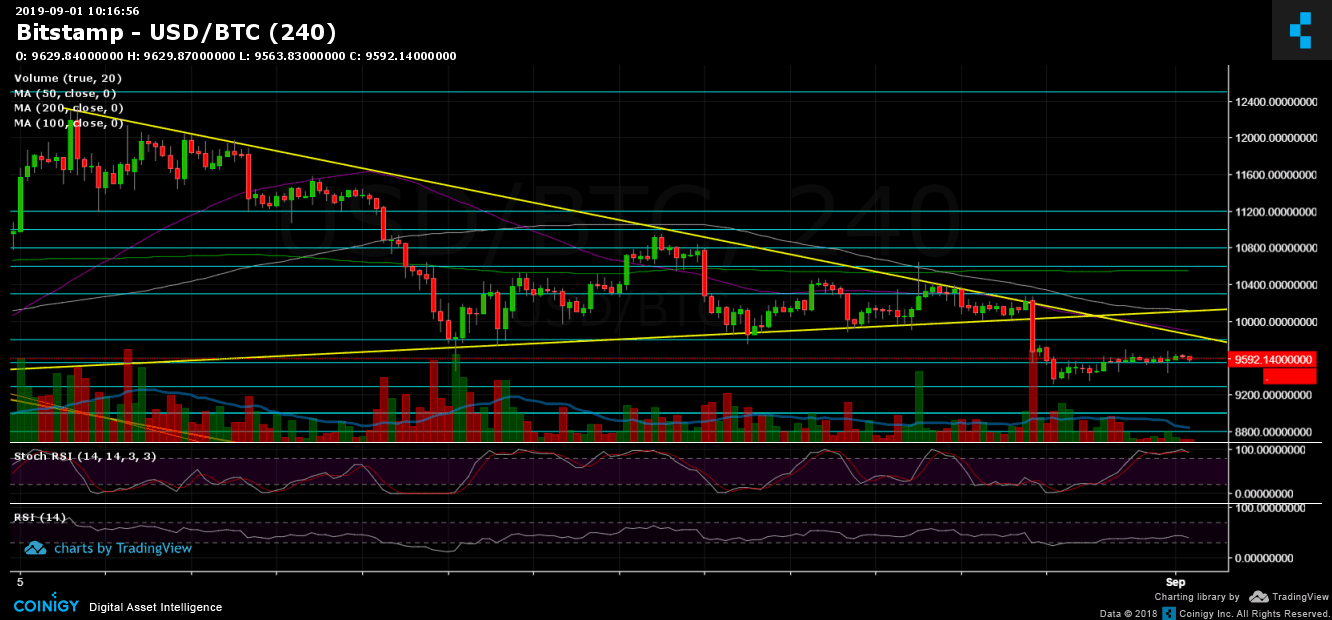
Most indicators are showing bearish; however, Bitcoin likes to go with the unexpected. The bigger picture is still a descending bearish triangle formation over the past month and a half.
After several touching points, Bitcoin is trading around $9600, whereas the bottom of the triangle lies at $9200 (~$9000) and the second descending trend-line which combines the upper angle lies around $10,300 – $10,400.
Hence, there is a high probability that the end of this calm is indeed a sharp move, either to the top at $10,300 or to the bottom of the triangle around $9200.
Total Market Cap: $249 billion
Bitcoin Market Cap: $172 billion
BTC Dominance Index: 69.2%
*Data by CoinGecko
Key Levels to Watch
– Support/Resistance:
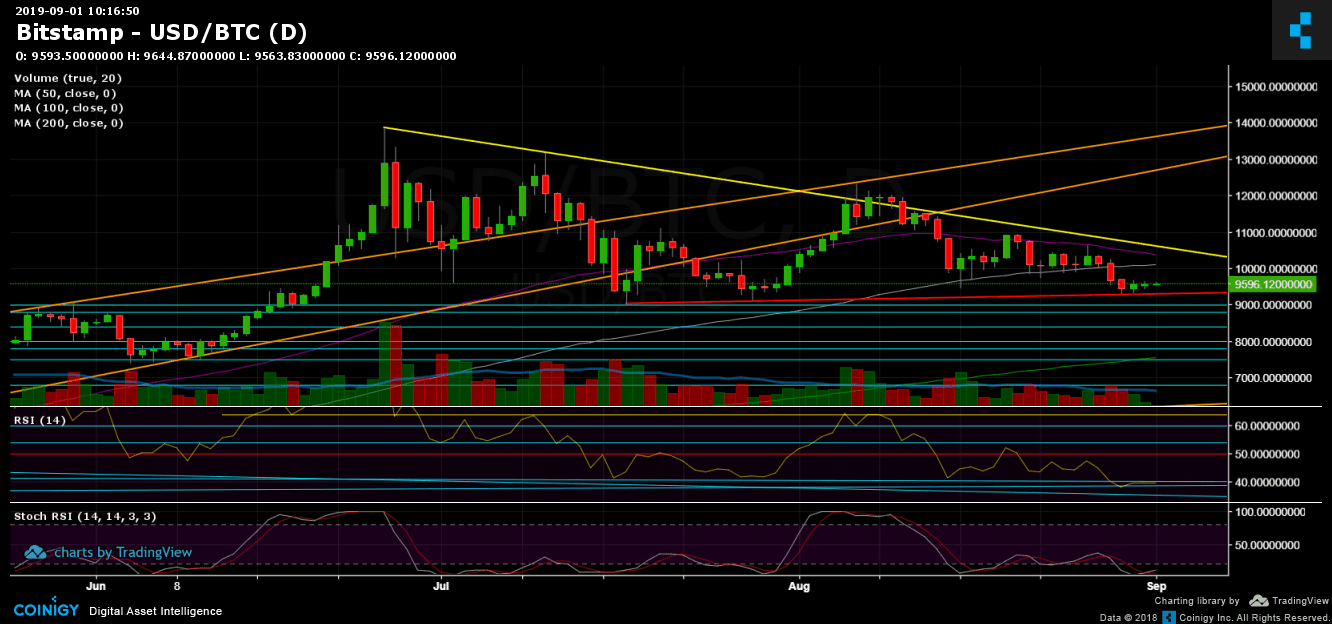
Since our previous analysis, the smaller picture hadn’t’ changed much regarding support and resistance levels. Bitcoin is now trading between high demand and supply area of $9500 – $9600. The nearest support lies at $9400, whereas the next significant support level is the $9200, where lies the mentioned ascending trendline (marked red on the daily chart), which contains the lows since reaching 2019 high and coming down. Further below lies $9000, $8800, and $8500 (levels for the short term).
From the bullish side, the next major level of resistance is now at $9700 – $9800 and $10,000 (along with the 4-hour smaller triangle’s boundary that broke down three days ago, and the significant 100-days moving average line – marked white). Further above are $10,300 and the 50-days moving average line (currently around $10,400), which Bitcoin had failed to break-up early this week.
– Daily chart’s RSI: The RSI is trading at its lowest areas since February 2019. Currently, the RSI is fighting with the 40-resistance line. The Stochastic RSI oscillator is showing signs of a possible upcoming correction following a crossover at the oversold area. However, it still awaits entering the bullish territory.
– Trading Volume: The past three days, along with the weekend, show almost now volume. The past two weeks, in general, were followed by a low amount of trading volume. This is also a sign that a sharp price move is anticipated.
BTC/USD BitStamp 4-Hour Chart
BTC/USD BitStamp 1-Day Chart
More news for you:


The post appeared first on CryptoPotato


