
With a bullish sentiment reaffirmed by EOS’s technical indicators, the altcoin was on its way to breach a key resistance level over the next few trading sessions.
IOTA traders speculated the rise of bullish sentiment, but a weakening buying sentiment could soon cause a trend reversal for the altcoin. FTX token, on the other hand, was poised for further gains and remained bullish.
EOS
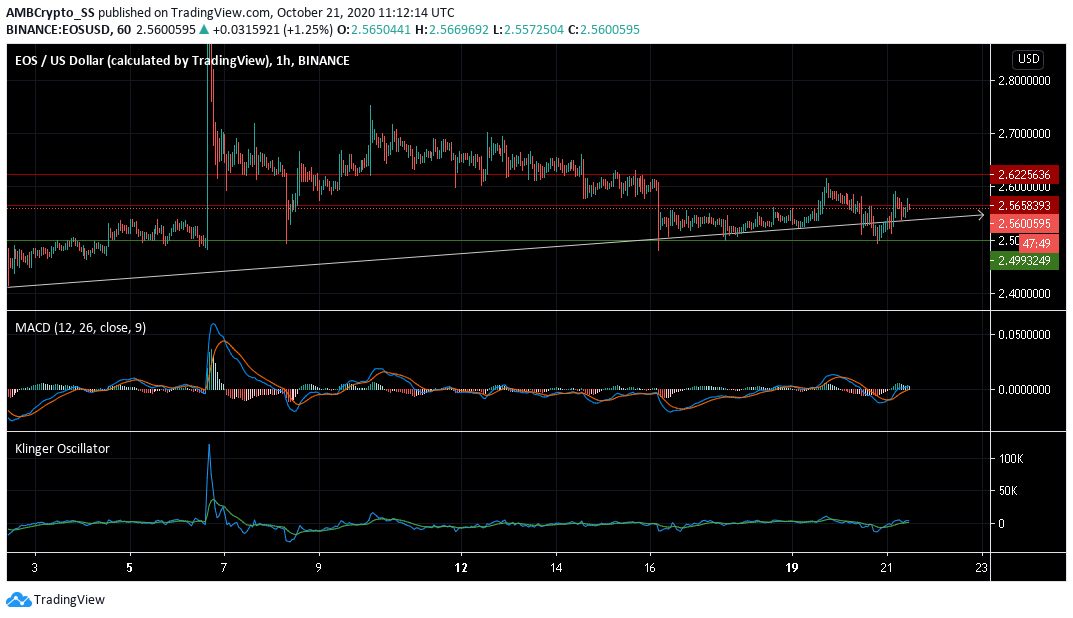
EOS seemed to gather good buying momentum as it prolonged its price recovery journey. The bulls managed to push the prices above the $2.499 level of support over the last 24 hours.
The MACD line took over the signal line and formed a bullish crossover. The Klinger Oscillator also followed suit and displayed the presence of a buying sentiment into the EOS market, with its bullish crossover.
With the bulls capturing the $2.56 resistance level, a move above this level remains a likely scenario over the next few days.
IOTA
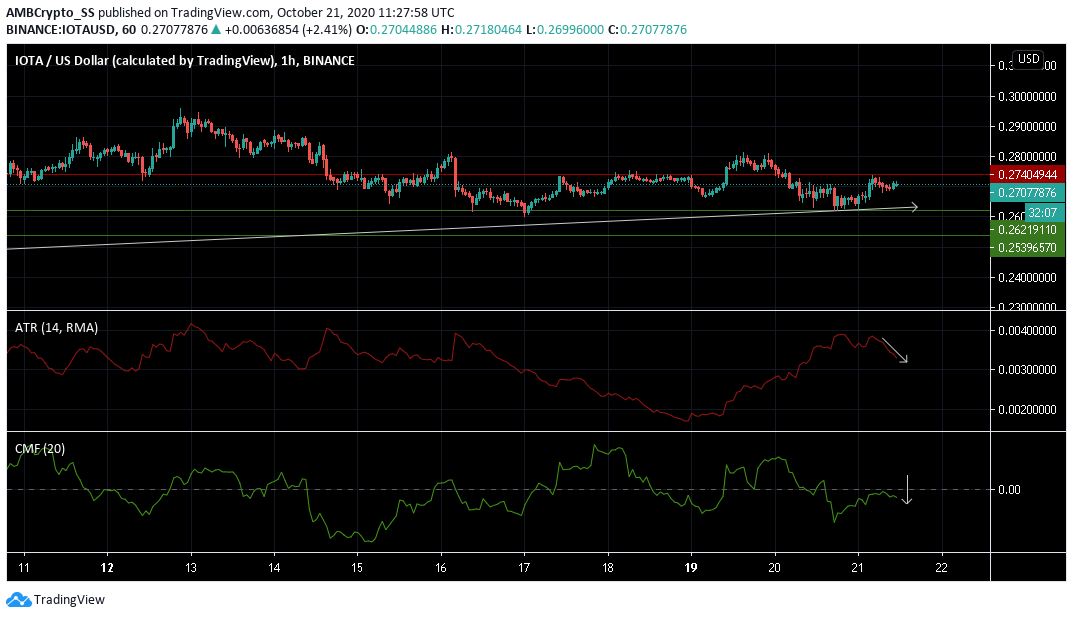
IOTA at the time of writing was trading close to its resistance level at $0.274. It recorded a price gain of almost 2% over the past 24-hours.
Despite this at press time, IOTA signaled a downtrend as it failed to gain control over its immediate resistance level. Average True Range, used to measure market volatility was in a downtrend, making lower highs and signaling a dip in IOTA’s volatility level.
Chaikin Money Flow was below the zero line, suggesting capital outflows were greater than capital inflows, and painted a bearish outlook for the price movement as it pointed southwards.
Given this scenario, if bulls fail to gather control at the immediate resistance level, a trend reversal to bearish could be witnessed in the IOTA market soon.
FTX Token [FTT]
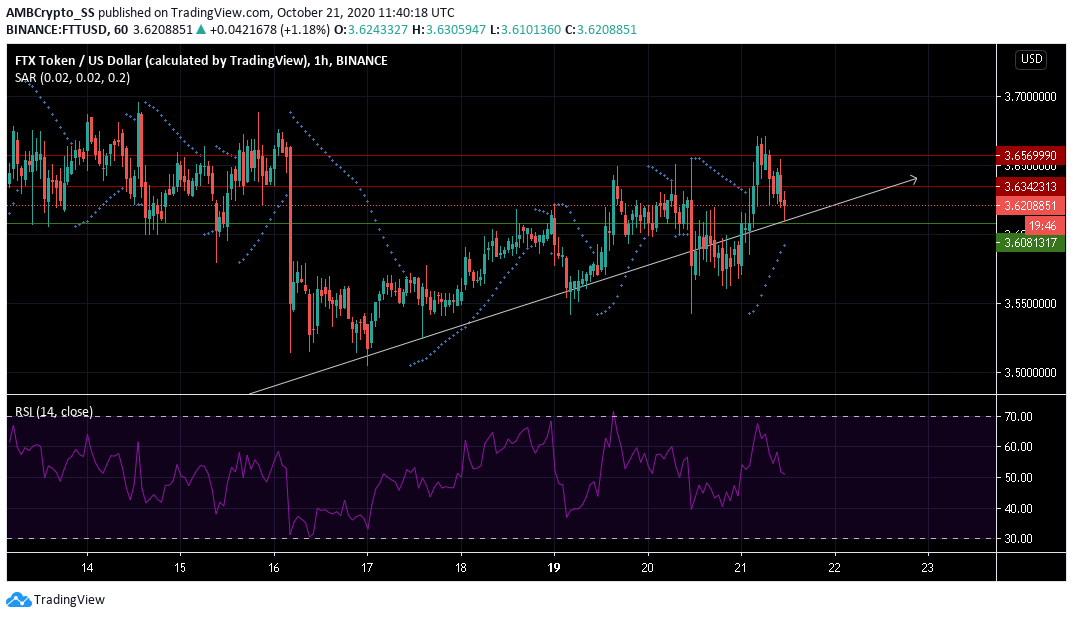
FTT the native coin of the FTX ecosystem, over the last 24 hours, was up by almost a percent and its LTP was $3.620
Hovering just above its support level, the digital asset nevertheless displayed a strong uptrend over the last couple of days, as FTT bulls managed to push prices further up.
The uptrend was at press time witnessing a minor reversal, as the Relative Strength Index (RSI) dove towards the 50-neutral level. This also coincided with the recent price dump as prices fell from the $ 3.656 level of resistance.
However the dotted lines of the Parabolic SAR below the candles seemed to not support the crypto currency’s recent sell-off, and with FTT’s overall uptrend, a move above the $3.608 support may be expected.
The post appeared first on AMBCrypto


