
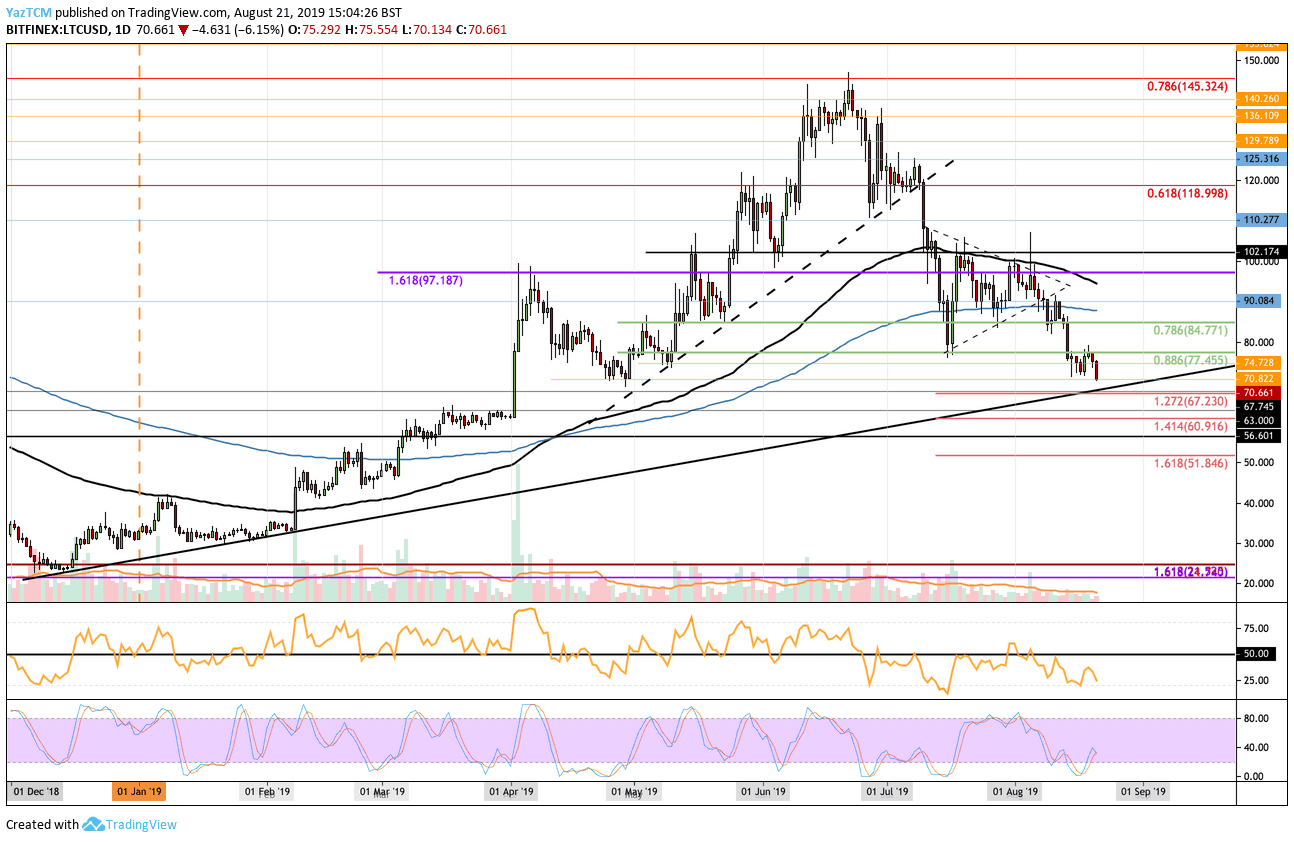
Litecoin has seen a further 5% price decrease over the past 24 hours, which has brought the price of the cryptocurrency down to $70. This latest price drop is mostly a result of Bitcoin dropping back beneath the $10,000 region as things start to look bleak for the overall cryptocurrency market.
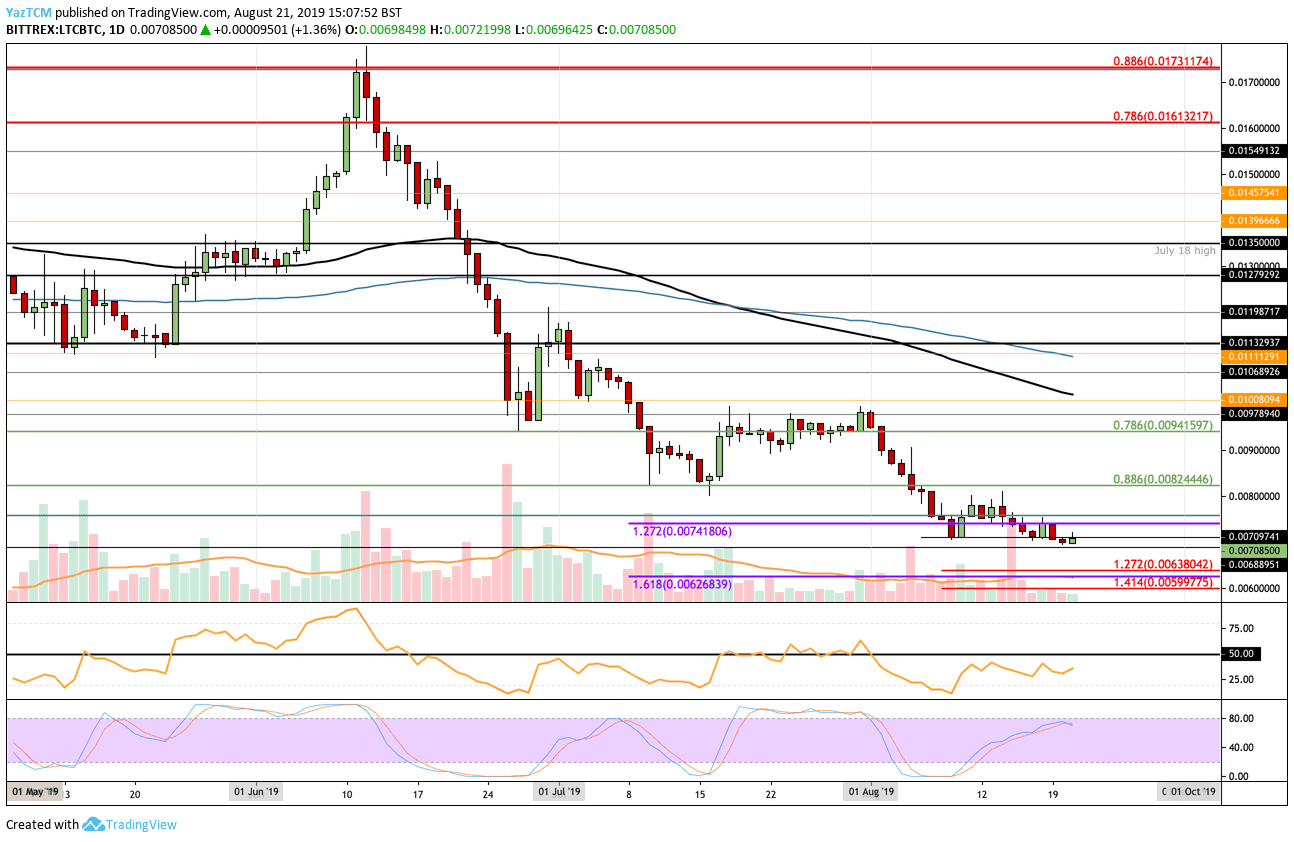
Litecoin remains the fifth-largest cryptocurrency with a market cap of $4.47 billion. Litecoin has managed to rebound at the 0.007 BTC level against BTC – but if this support breaks, we could see Litecoin at $50 over the next few weeks.
-
Since our previous Litecoin analysis, we can see that Litecoin has fallen back into our support at the $70 level. The cryptocurrency seems to be on the bearish footing – mainly accommodated by the recent BTC breakdown. Some positive news could be coming upon reaching down to the significant support level around $67.
-
From above: The nearest level of resistance lies at $74.72 and $77.45. Above this, higher resistance lies at $80, $84.77 and $88 (200 days EMA). If the bulls can break above the 200 days EMA, further higher resistance lies at $90, $95 – $96.18 and $100.
-
From below: The nearest level of support is located at $67.23, which is provided by a short term downside 1.272 Fibonacci Extension level. This level of support is further bolstered by a long term rising support line. This combined area of support is expected to allow the market to rebound. If the sellers do break beneath this level, further support can be found at $65, $63, $60.91 and $56.60.
-
The trading volume remains low, same as the rest of the market.
-
The RSI indicator is below the 50 level, which shows that the sellers are in complete control of the market.
-
Against Bitcoin, we can see that LTC has fallen further lower but has managed to find strong support at the 0.007 BTC level. Like the majority of the altcoins, Litecoin forecast is looking dire against BTC. However, if BTC does continue to fall – we may see a resurgence within the altcoin market, which would see LTC/BTC surge.
- The RSI is rising, which is a promising sign. It shows that the sellers are starting to lose their strength within the market. However, we would need to see the RSI break above the 50 level for any bullish recovery. The Stochastic RSI is looking to produce a bearish crossover signal which could be a bad sign for the bulls.
Be the first to know about our price analysis, crypto news and trading tips: Follow us on Telegram or subscribe to our weekly newsletter.
More news for you:

By Mandy Williams / Aug 21, 2019

By Yordan Lyanchev / Aug 21, 2019

By Yuval Gov / Aug 21, 2019

By Yoni Berger / Aug 20, 2019

By Yoni Berger / Aug 20, 2019

By George Georgiev / Aug 20, 2019
By Yaz Sheikh / Aug 19, 2019
By George Georgiev / Aug 19, 2019

By Yuval Gov / Aug 19, 2019

By Yaz Sheikh / Aug 18, 2019

By George Georgiev / Aug 18, 2019

By George Georgiev / Aug 17, 2019

By Yuval Gov / Aug 17, 2019

By Yordan Lyanchev / Aug 16, 2019
By Yaz Sheikh / Aug 16, 2019

By Yordan Lyanchev / Aug 16, 2019

By Yaz Sheikh / Aug 15, 2019

By Yuval Gov / Aug 15, 2019

By George Georgiev / Aug 15, 2019

By Yaz Sheikh / Aug 14, 2019
The post appeared first on CryptoPotato


