
- After a two-week correction, LRC recently found a bottom and bounced back with 10% gains under 24 hours.
- It may start a new bullish cycle if the weekly low continues to hold as support.
LRC/USD: Loopring Forming Bull Flag Pattern
Key Resistance Levels: $0.089, $0.95
Key Support Levels: $0.72, $0.62
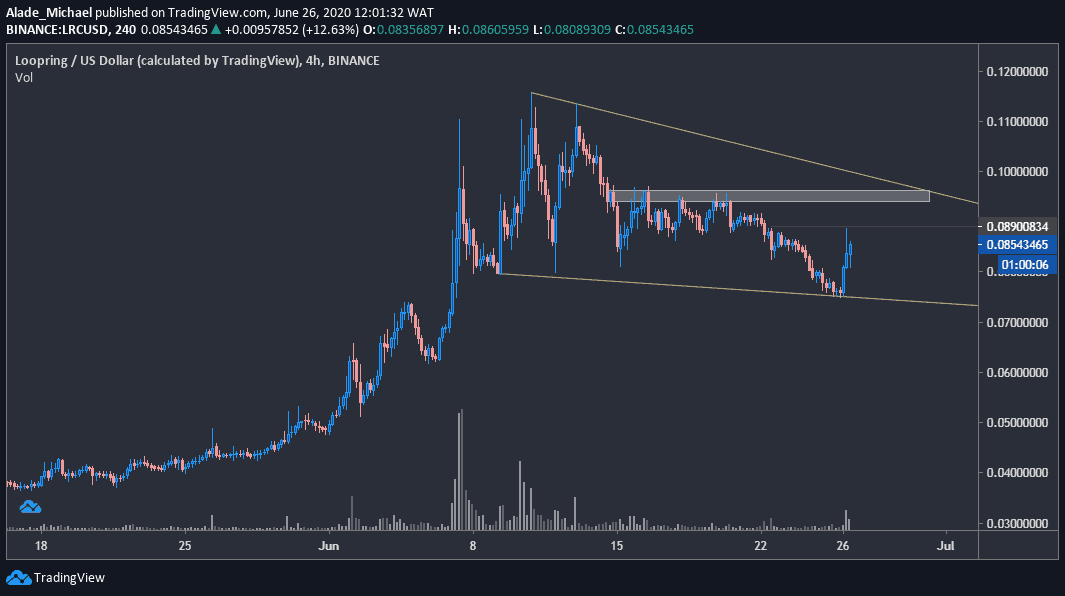
Earlier this year, Loopring started to gain momentum after dropping to around $0.02 in March. After witnessing a three-month surge to $0.1168 on June 10, the price corrected to $0.72 yesterday, but it is slowly bouncing back at the moment.
It is technically following a bullish flag pattern on the daily chart. A continuation should be expected once the price breaks up this triangle.
The reverse will be the case for Loopring if the price drops below the current daily low of $0.075. Regardless of the above analysis, the price is currently up by 10.62% as buyers look for more gains.
Loopring Price Analysis
LRC still trades at around $0.83 against the US Dollar. It recently rejected the $0.89 level. If the buyers successfully retake this level, the next price targets would be the grey resistance area at $0.95.
As mentioned above, a clear break above the triangle should trigger a fresh bullish cycle to $0.15.
Currently, the LRC/USD pair is supported by $0.75, around the lower boundary of the triangle. A break below this crucial support may cause a severe selloff to $0.62 or even $0.53 in no time.
LRC/BTC: It Slightly Rebounded Above 800 SAT
Key Resistance Levels: 1025 SAT, 1200 SAT
Key Support Levels: 822 SAT, 653 SAT
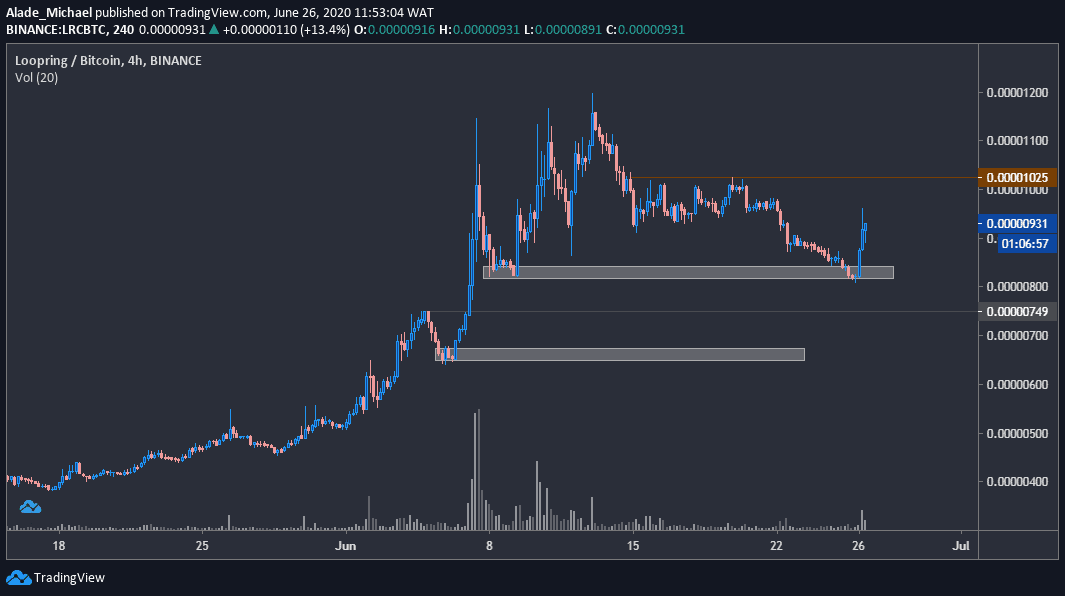
After a steady 13-days decline from the 1198 SAT level, Loopring found temporary support at 819 SAT today and bounced back with 10.7% to reach 961 SAT. But the price got rejected to 896 SAT at the time of writing.
The recovery still appeared mild in the above 4-hours chart. However, if the immediate grey area continues to act as support, more buying action can be expected. The orange horizontal resistance will be a key price target for the bulls if they manage to regroup above the 961 SAT level.
But if they fail to show strong commitment above 800 SAT level, the correction may get uglier in the coming weeks. Notwithstanding, Loopring remains bullish on a mid-term perspective.
LRC Price Analysis
Once the price increases above the 961 SAT level along with the 1025 SAT resistance, indicated orange, the next resistance to keep in mind is the monthly high at 1200 SAT. Key resistance above this level is likely at around 1500 SAT.
The 822 SAT level is currently acting as support over the last 24-hours. Right below this area lies small support at 750 SAT. The next critical support can be found at the 653 SAT level, where the second grey spot lies.
Click here to start trading on BitMEX and receive 10% discount on fees for 6 months.
Disclaimer: Information found on CryptoPotato is those of writers quoted. It does not represent the opinions of CryptoPotato on whether to buy, sell, or hold any investments. You are advised to conduct your own research before making any investment decisions. Use provided information at your own risk. See Disclaimer for more information.
The post appeared first on CryptoPotato


