
Litecoin (LTC) broke a minor resistance at the $43 level and prices seem to be supported by a generally bullish market bias.
As the top crypto correlates with the price of Bitcoin (BTC), its price stalked the $42 and $43 levels concurrently amid few days of ranging markets.
As prices initially fell towards $40 as of May 11, 19:14 UTC hours, the LTC/USD pair gathered support at the 0.78 Fibonacci retrace level.
This returned price movement to a short term bullish pattern which escorted it to the present level at $43.
Since yesterday, prices are contained within close range. Ranging between $44.5 and $42.5, LTC’s push beyond $44.5 was rejected at the 0.5 Fib level. Crashing down by a little margin, the bears appear to be in serious contention for a market takeover.
However, chances of the markets moving in a particular direction are still very much open and presently undecided.
LTC/USD 4-Hour Chart
On the 4-hour timeframe, Litecoin wiped out and stabilized above the resistance level of $ 43. Given the market excitement, the asset may gradually go up to the resistance level of $45.5.
However, it appears more rational to go closer to the levels. In this case, closer to $43.
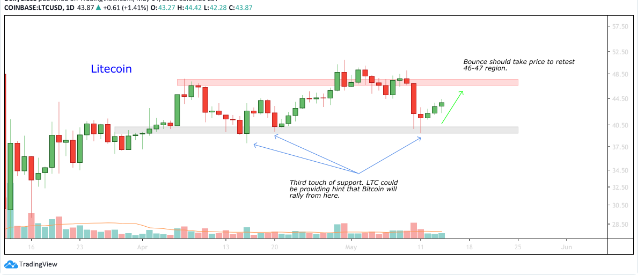
The nearest resistance and support levels appear to be equally spaced out. The next support level, in the event that price penetrates the present support at $43 lies at $41.
The further move downwards may see prices testing the support at $40 mark again.
Conversely, if the price shoots up from here, the next area of resistance is expected at $45.1, and further, pull up may send the price towards the $47 and finally, the $50 mark.
Also read , Litecoin Price Prediction 2020 – What’s The Future Of Litecoin?
LTC/USD 1-Day Timeframe Chart
On the 1-day chart, the next area of resistance lies around $80. This long term bull run is expected to meet resistance at the $50. If the area is broken, then buyers may push prices forward to $53 and $55.
However, this may not come into play as the markets presently struggle to gain momentum in any particular direction.
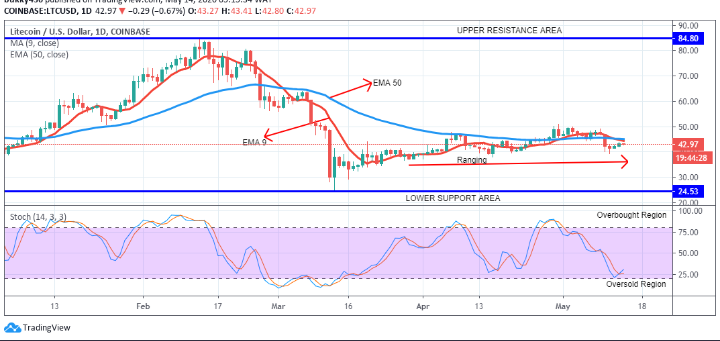
The stochastic below the chart also explains why a bull run can be expected in the long term.
The markets appear to have just relented from a bearish turn as the indicator reveals a U-turn from the oversold condition at 20.0
The post LTC/USD Floats Above $43 With A Possible Steady Growth Towards $45 appeared first on Cryptocurrency information | Cryptocurrency News | Bitcoin News and Crypto Guide.
The post appeared first on Coinpedia


