
Following on from the first instalment in our series, this piece dives deeper into continuation patterns and how to identify flags, pennants and wedges to better inform your trading.
What is a Continuation Pattern?
Continuation patterns refer to any pattern that indicates signs of price trend continuation. When the pattern appears, you can expect the observed price trend to continue.
What is a Flag Pattern?
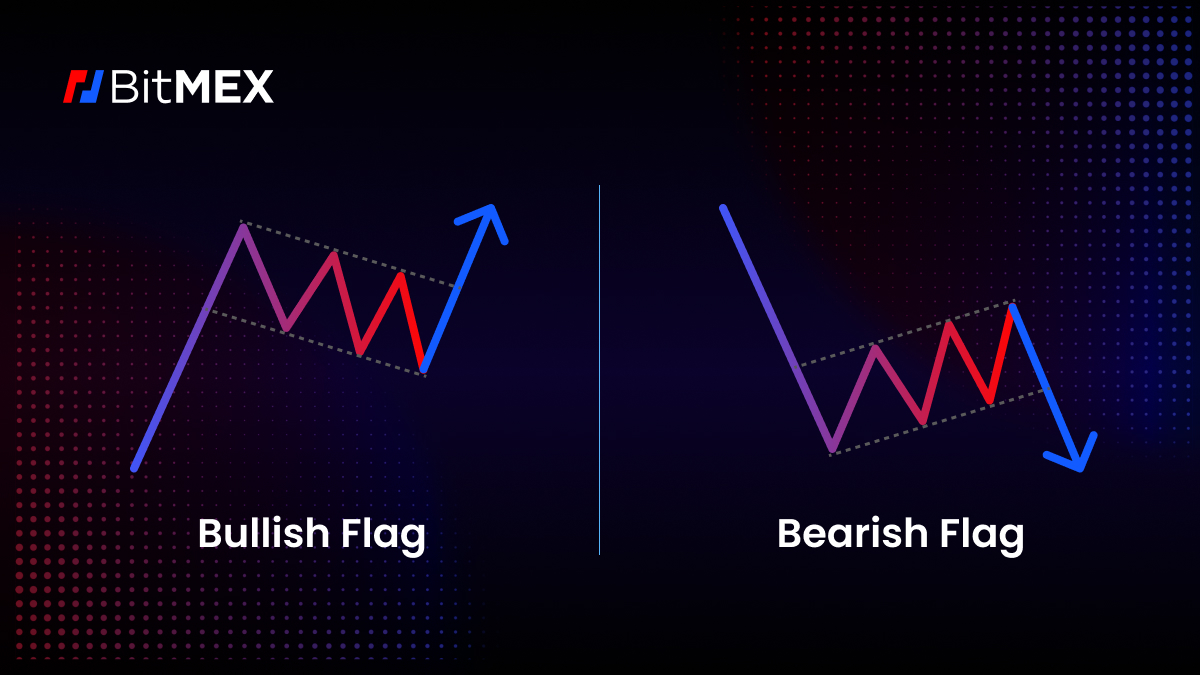
The flag pattern is characterised by a steep price movement (the “flagpole”) followed by a period of consolidation (the “flag”) in the opposite direction of the initial movement.
With its straightforward visual structure and robust predictive capabilities, the pattern is easy to identify, making it a useful reference point for advanced traders and their decision making.
What are the Indicators of a Flag Pattern?
- Price Movement: A flag pattern is initiated by a significant price movement of the flagpole, which can be bullish or bearish.
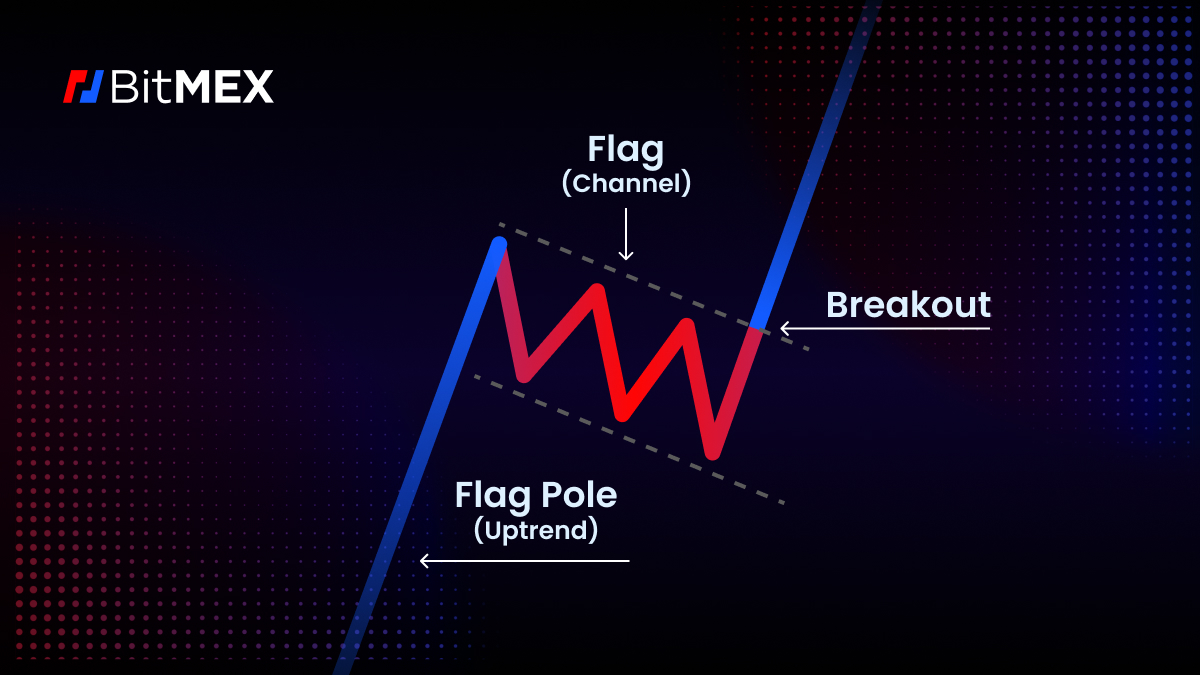
- Consolidation Area: In the flag part of the pattern, price consolidation is typically in the shape of a rectangle. This consolidation usually takes place in a channel, where prices move in parallel to the trend lines.
- Flagpole: The first price movement before the consolidation area is known as the “flagpole”. In relative terms, the length of the “flagpole” indicates the “potential target” for the subsequent price movements.
- Flag: The consolidation area, also known as the “flag”, is characterised by a relatively low trading volume and price movement. Ideally, the flag should slope away from the flagpole in the opposite direction.
How to Confirm a Flag Pattern?
- Duration: Flags are usually short-term patterns that last a few hours or days. The longer the flag pattern extends, the less reliable it becomes.
- Volume: During the flag consolidation phase, trading volume is expected to be lower than the flagpole consolidation phase. A lower volume indicates reduced market activity and potential exhaustion.
- Breakout Confirmation: A bullish breakout occurs when the price breaks above the flag’s upper trendline. A bearish breakout happens when the price breaks below the flag’s lower trendline. The breakout should be accompanied by a significant increase in trading volume to validate the new trend.
What is a Pennant Pattern?
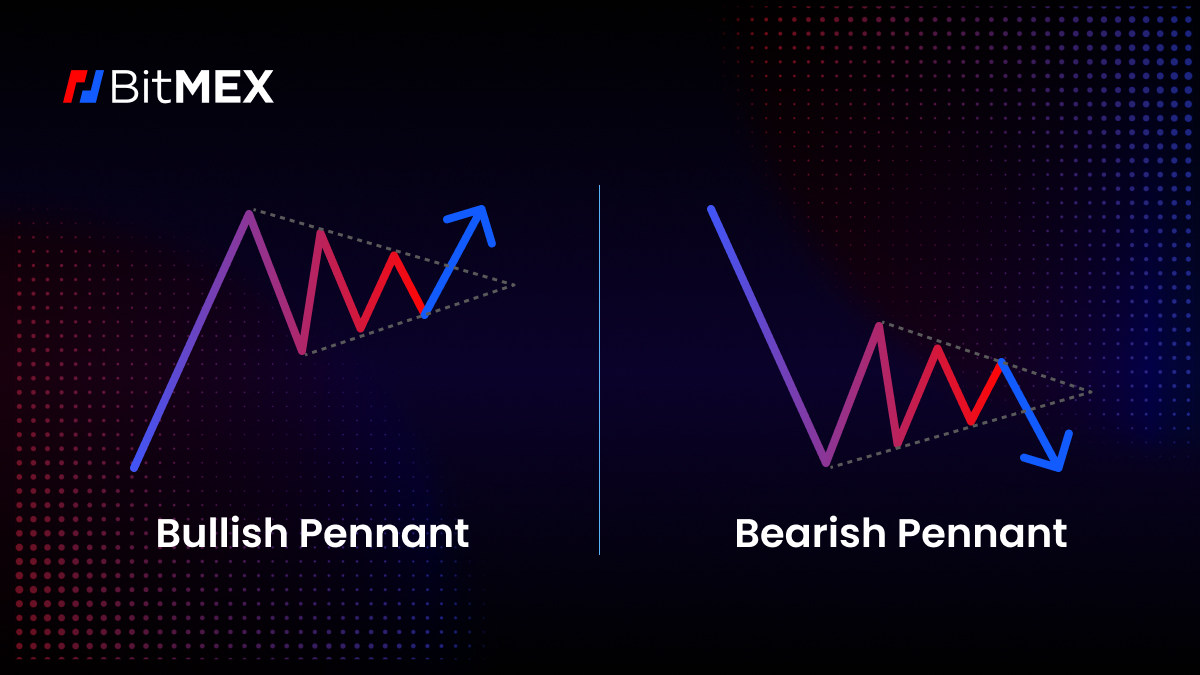
The pennant pattern is a short-term consolidation pattern that commonly appears after a significant price movement. The pennant is characterised by the formation of a symmetric, triangular trendline between the highs and the lows.
What are the Indicators of a Pennant Pattern?
- Symmetrical Triangle: The converging trend lines of the pennant itself forms a symmetrical triangle, indicating a decrease in volatility and possible consolidation before the next price movement.
- Volume Contraction: Trading volume tends to decline when a pennant forms, reflecting a decrease in market participation.
How to Confirm a Pennant Pattern?
- Breakout Direction: The pennant pattern is confirmed when the price breaks out from the symmetrical triangle. The breakout direction is determined by the previous trend’s direction. If the trend prior to the pennant was upwards, the pennant breakout should also be upwards, and vice versa.
- Volume Surge: The pattern is confirmed by a strong breakout accompanied by a sudden surge in trading volume.
- Target Calculation: The flagpole height can be measured and projected from the breakout point, allowing traders to identify a potential price target for the price movement after the breakout.
What is a Wedge Pattern?
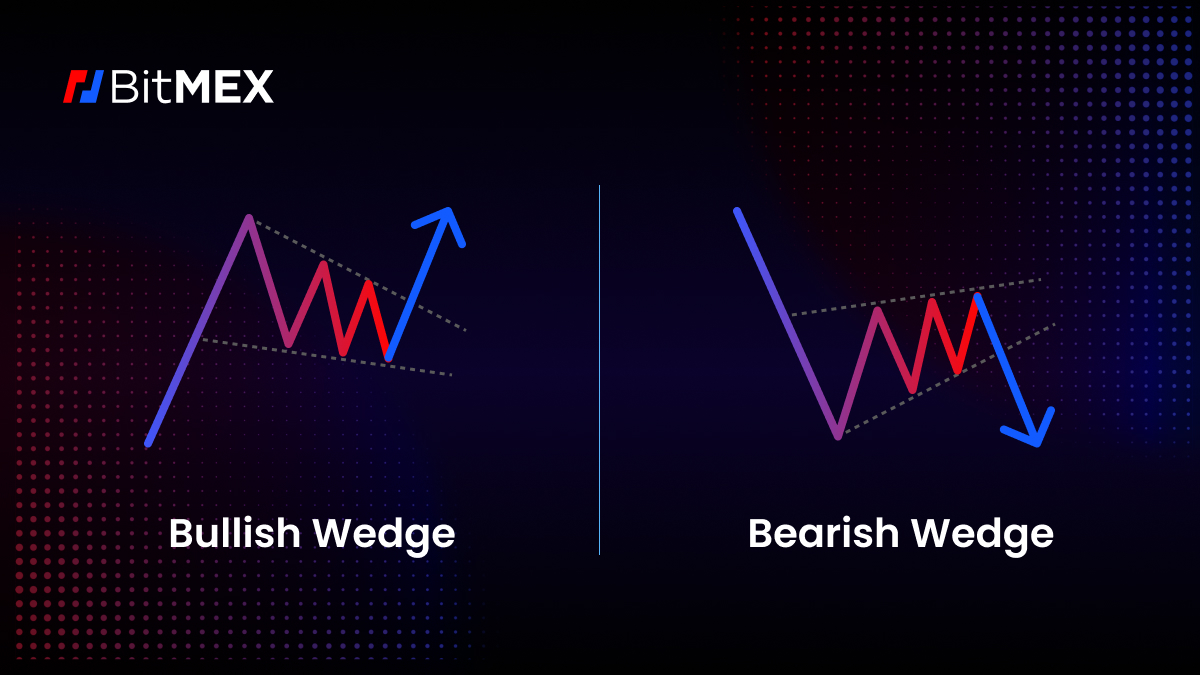
The wedge pattern is characterised by a convergence of trend lines which either slope upwards or downwards. The pattern suggests a continuation of the trend and a possible price reversal upon breakout.
This is an important tool for traders with its well-defined structure which provides a clear entry and exit point, making it easy for all traders to identify. There are two primary wedge patterns – the ascending wedge as a bearish signal and the descending wedge as a bullish signal.
What are the Indicators of a Wedge Pattern?
- Trend Lines: A wedge pattern is characterised by the convergence of trend lines. In an ascending, bearish wedge, the support trend line (lower trend line) and the resistance trend line (upper trend line) converge upwards. In a descending, bullish wedge, the trend lines of both converge downwards.
- Price Movement: In an ascending wedge, prices reach consistent highs and slightly higher lows in the pattern. In a descending wedge pattern, prices reach consistent lows and lower highs.
- Volume: Generally, volume decreases as a wedge pattern matures. A significant rise in volume when a price breaks out of a wedge pattern can indicate a more significant potential movement.
How to Confirm a Wedge Pattern?
- Duration: Wedge patterns typically take a few days or weeks to form.
- Breakout Confirmation: A valid breakout is when the price deviates from a wedge pattern in the opposite direction to the convergence of trend lines. A downside breakout in an ascending wedge or an upside breakout in a descending wedge confirms the pattern.
- Volume Confirmation: The higher the volume on the breakout, the more valid the pattern is. A breakout with high volume is more likely to lead to a significant price movement.
- Price Target: In order to determine the subsequent price movement after a breakout, the wedge pattern height can be determined by projecting the wedge pattern direction in the breakout direction. For a bearish trade, measure the height from the pattern’s highest point to the support line downward. for a positive trade, measure from the lowest point to the resistance line and project it upwards.
How to Trade with Continuation Patterns
1. Identify the trendline
Check the pre-existing patterns on your chart – was there any difference in price before the continuation pattern?
If so, was it increasing or decreasing? This plays a part in determining the potential breakout.
2. Find the breakout point
Traders can only take profits depending on the breakout point and trend direction. Some may take profits during reversals.
3. Trade
Make your trade.
Part three of this series will cover the roles and types of triangles in continuation patterns and how to identify them.
Theoreticals aside, if you wish to begin trading crypto derivatives or spot on BitMEX, you can find all our existing products here. For more educational resources on trading at BitMEX, particularly derivatives, visit this page.
To be the first to know about our new listings, product launches, giveaways and more, we invite you to join one of our online communities and connect with other traders. For the absolute latest, you can also follow us on Twitter, or read our blog and site announcements.
Related
The post appeared first on Blog BitMex


