

This piece will delve further into triangular continuation patterns, and how their angles can help you take your trading to the next level. It is a continuation of a previous look at the basics of chart patterns and its different types (flags, pennants and wedges).
What are Triangular Patterns?
A triangle pattern is observed when the highest and lowest points of the price gradually converge to form a triangle-shaped pattern.
Triangle patterns can be divided into three main categories; ascending triangles, descending triangles, and symmetrical triangles.
What are Ascending Triangle Patterns?
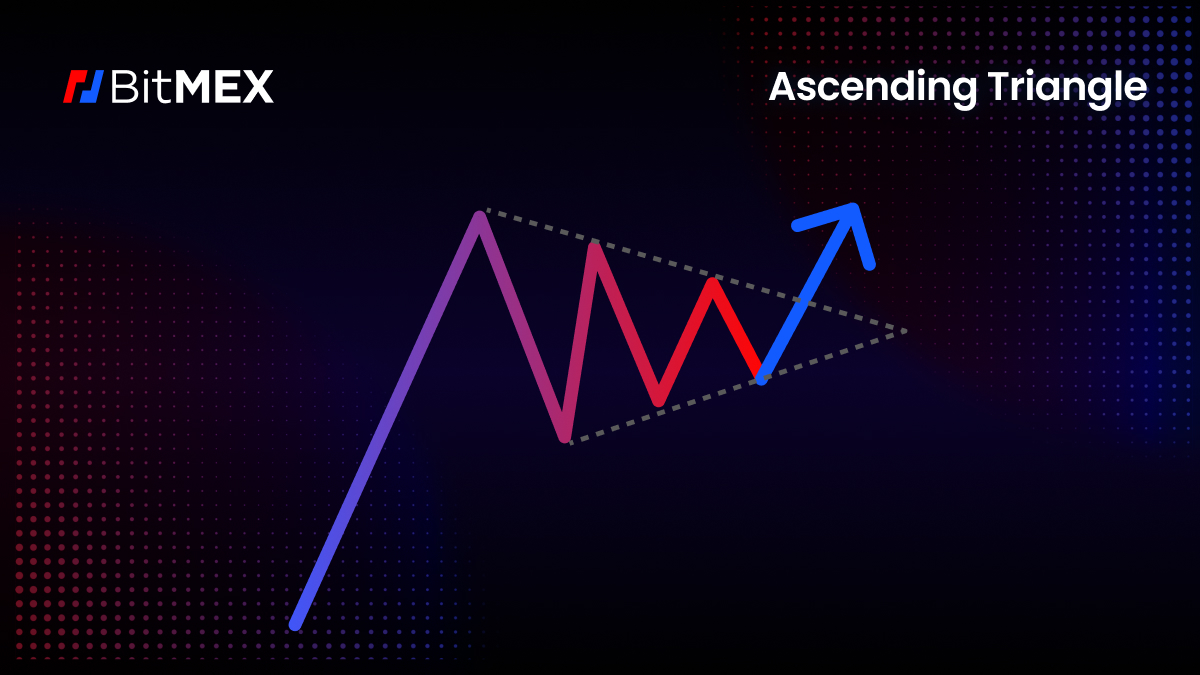
The ascending triangle is a bullish pattern in trading. It consists of a horizontal resistance along an ascending lower trendline to form a triangle shape.
What are the Indicators of an Ascending Triangle Pattern?
- Trendlines: An ascending triangle is composed of two trend lines. The top trendline is horizontal, which connects the swing highs, and the bottom trendline is vertical, which connects the higher lows.
- Converging Lines: The triangular shape is formed by the convergence of the two trendlines as the pattern progresses. This signals an increase in buying momentum and sellers actively trading around the support level.
- Volume: Generally, volume tends to decrease as the price approaches the apex (the intersection point of the two trend lines). A breakout with a rising volume is seen as more significant than a breakout with a low volume.
How to Confirm an Ascending Triangle Pattern?
- Breakout Confirmation: It is common for traders to seek confirmation of an ascending triangle pattern when the price breaks above the uptrend line. A breakout indicates that the selling pressure has been relieved, potentially triggering an uptrend movement.
- Volume Confirmation: In order for a breakout to be considered valid, a significant increase in volume should be observed in comparison to the volume during the consolidation phase of the pattern.
What are Descending Triangle Patterns?
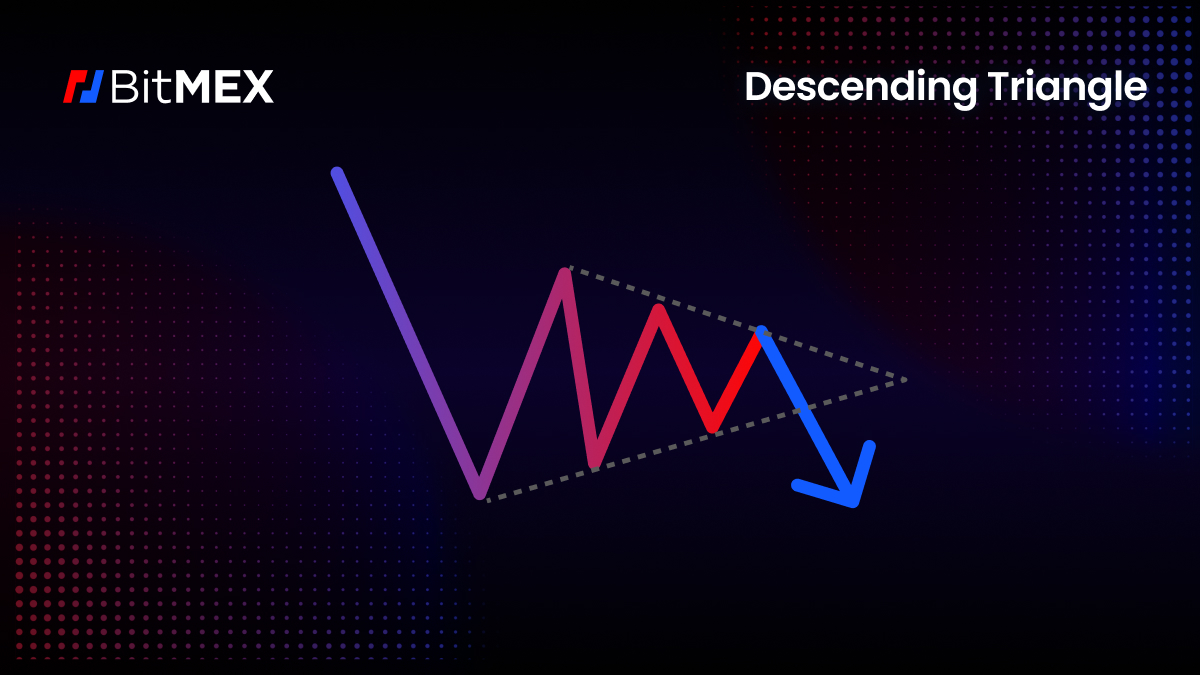
A descending triangle indicates that price consolidation is likely to happen before a breakout.
The descending triangle pattern is one of the most common bearish continuation patterns. It is made up of a sequence of lower highs where the price never breaks above a descending resistance line and a series of horizontal support lines connecting a relatively equal series of lows.
The pattern suggests a possible continuation of a bearish trend, as selling pressure remains and buyers find it difficult to move the price upwards.
What are the Indicators of a Descending Triangle Pattern?
- Trendlines: A descending triangle is characterised by two trend lines that connect on the top – the lower highs and on the bottom the horizontal or lower lows. This indicates a descending resistance line on the top and an unambiguous level of support on the bottom.
- Converging Trendlines: The horizontal support line and the descending resistance line intersect, resulting in a triangle shape. A breakout often occurs when nearing the intersection.
- Volume: Trading volumes drop as the price nears the right most corner of the triangle and spikes suddenly upon breakout.
How to Confirm a Descending Triangle Pattern:
- Breakout Confirmation: A breakout happens when the chart crosses the horizontal support line. The breakout then tests the unambiguous level of support with a downward price movement.
- Volume Confirmation: A breakout that is accompanied by an increase in trading volume confirms the pattern and enhances the probability of significant price movement.
- Price Target: The vertical height of a triangle is typically measured at the widest point (between the highest point and the horizontal support line). The distance from that point to the breakout point is projected as a potential price target.
What are Symmetrical Triangle Patterns?
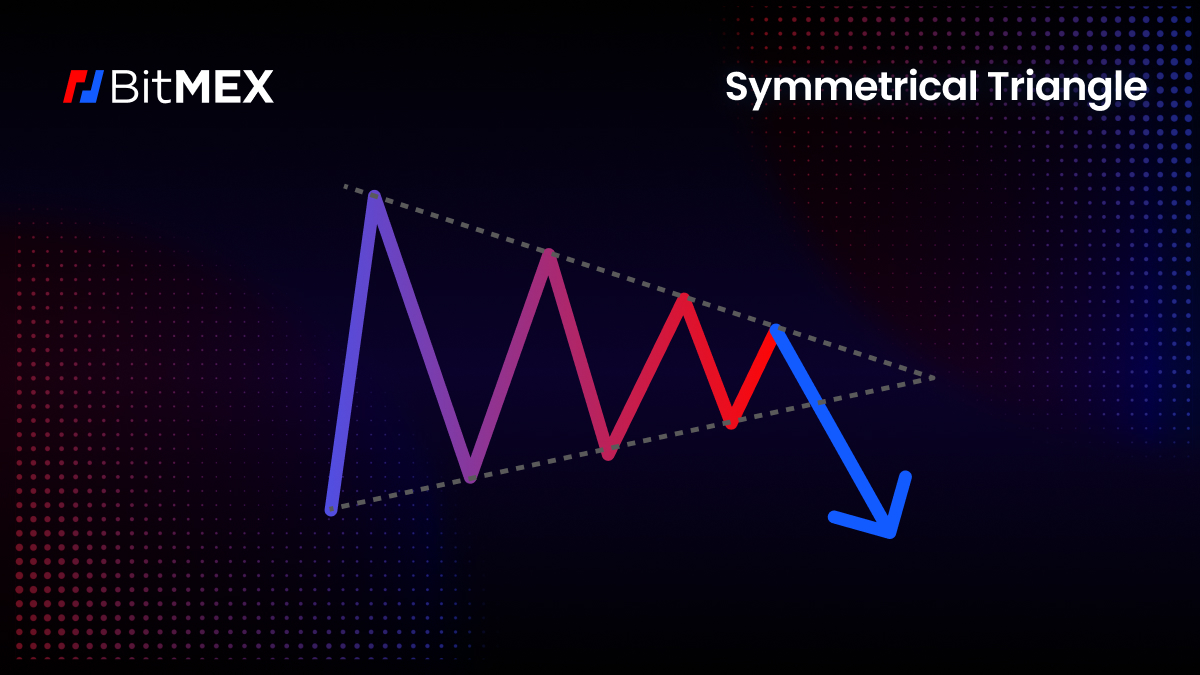
A symmetrical triangle consists of converging trendlines, which meet at a point to form a triangle shape. The pattern indicates a period of uncertainty and a potential price breakout.
The unambiguous nature of the pattern can also reflect market dynamics, which can be leveraged to form more complex trading strategies such as analysing bullish or bearish scenarios.
What are the Indicators of a Symmetrical Triangle Pattern?
- Price Action and Trendlines: Symmetrical triangle patterns consist of two lines – the first line of ascending lows and a second line which connects a series of descending highs. The trend lines then converge to form a perfectly symmetrical triangle. The pattern is confirmed when the price intersects each trendline twice, resulting in multiple contact points.
- Volume Analysis: Observing trading volumes is crucial during the formation of a symmetric triangle. Trading volume tends to drop off as the price nears the right most corner of the triangle, which is indicative of low market activity and confidence.
- Duration: Symmetrical triangle patterns are often short-term patterns.
- Breakout Confirmation: Traders typically seek a definitive breakout, which is typically accompanied by a rise in trading volume and significant price movement in the breakout direction. The confirmation of the pattern’s robustness serves as a foundation for prospective trading decisions.
- Measuring Targets: Traders typically employ a measuring technique to determine potential price targets following a breakout. This technique involves determining the height of a triangle at the widest point (vertical distance between trend lines) and projecting the distance from that point to the breakout direction. This can be used to estimate a rough price movement target.
How to Trade with Continuation Patterns:
1. Identify the Trendline
Check the pre-existing patterns on your chart – was there any difference in price before the continuation pattern?
If so, was it increasing or decreasing? This plays a part in determining the potential breakout.
2. Find the breakout point
Traders can only take profits depending on the breakout point and trend direction. Some may take profits during reversals.
3. Trade
Make your trade.
Part four of this series will cover the neckline patterns in continuation patterns such as Cup and Handles, and Head and Shoulders and how to identify them.
Theoreticals aside, if you wish to begin trading crypto derivatives or spot on BitMEX, you can find all our existing products here. For more educational resources on trading at BitMEX, particularly derivatives, visit this page.
To be the first to know about our new listings, product launches, giveaways and more, we invite you to join one of our online communities and connect with other traders. For the absolute latest, you can also follow us on Twitter, or read our blog and site announcements.
Related
The post appeared first on Blog BitMex


