
Bitcoin Dominance stood at 65.7% as Bitcoin made strong gains while many of the large-cap altcoins followed suit. At press time BTC was being traded at $16,918 with a trading volume of $18.2 billion.
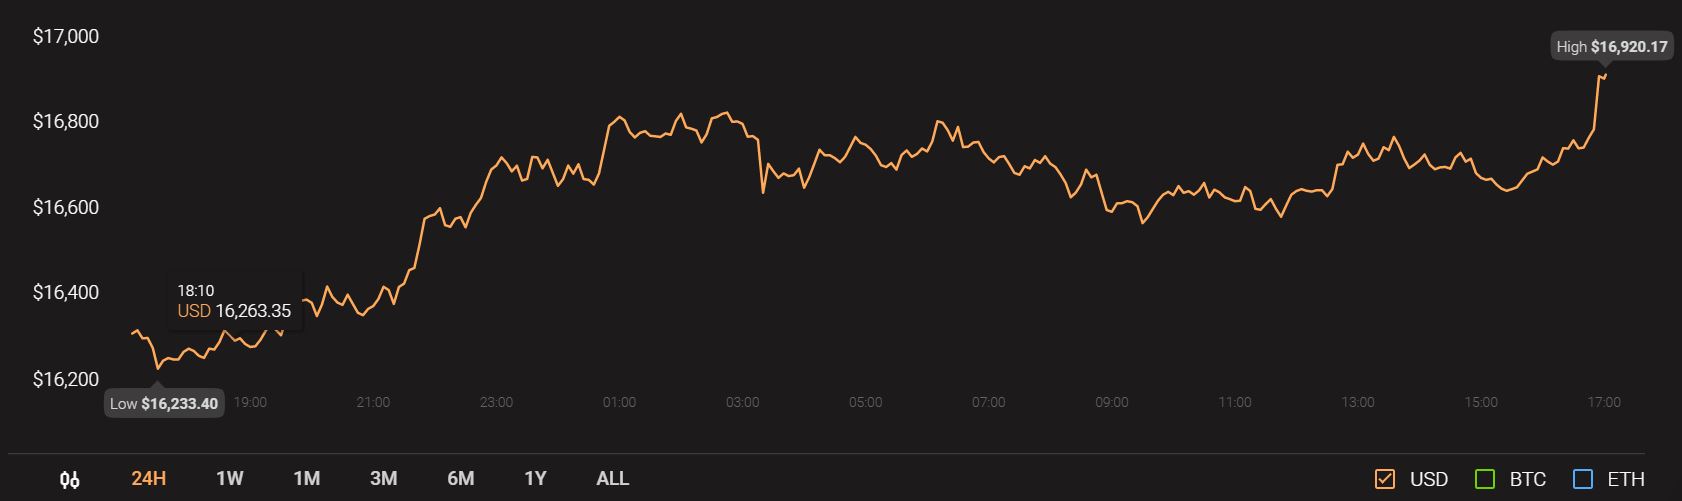
Source: CoinStats
Polkadot exhibited a bearish divergence but that does not necessitate an immediate pullback. IOTA appeared to begin another leg upward and Algorand showed bullish momentum.
Polkadot [DOT]
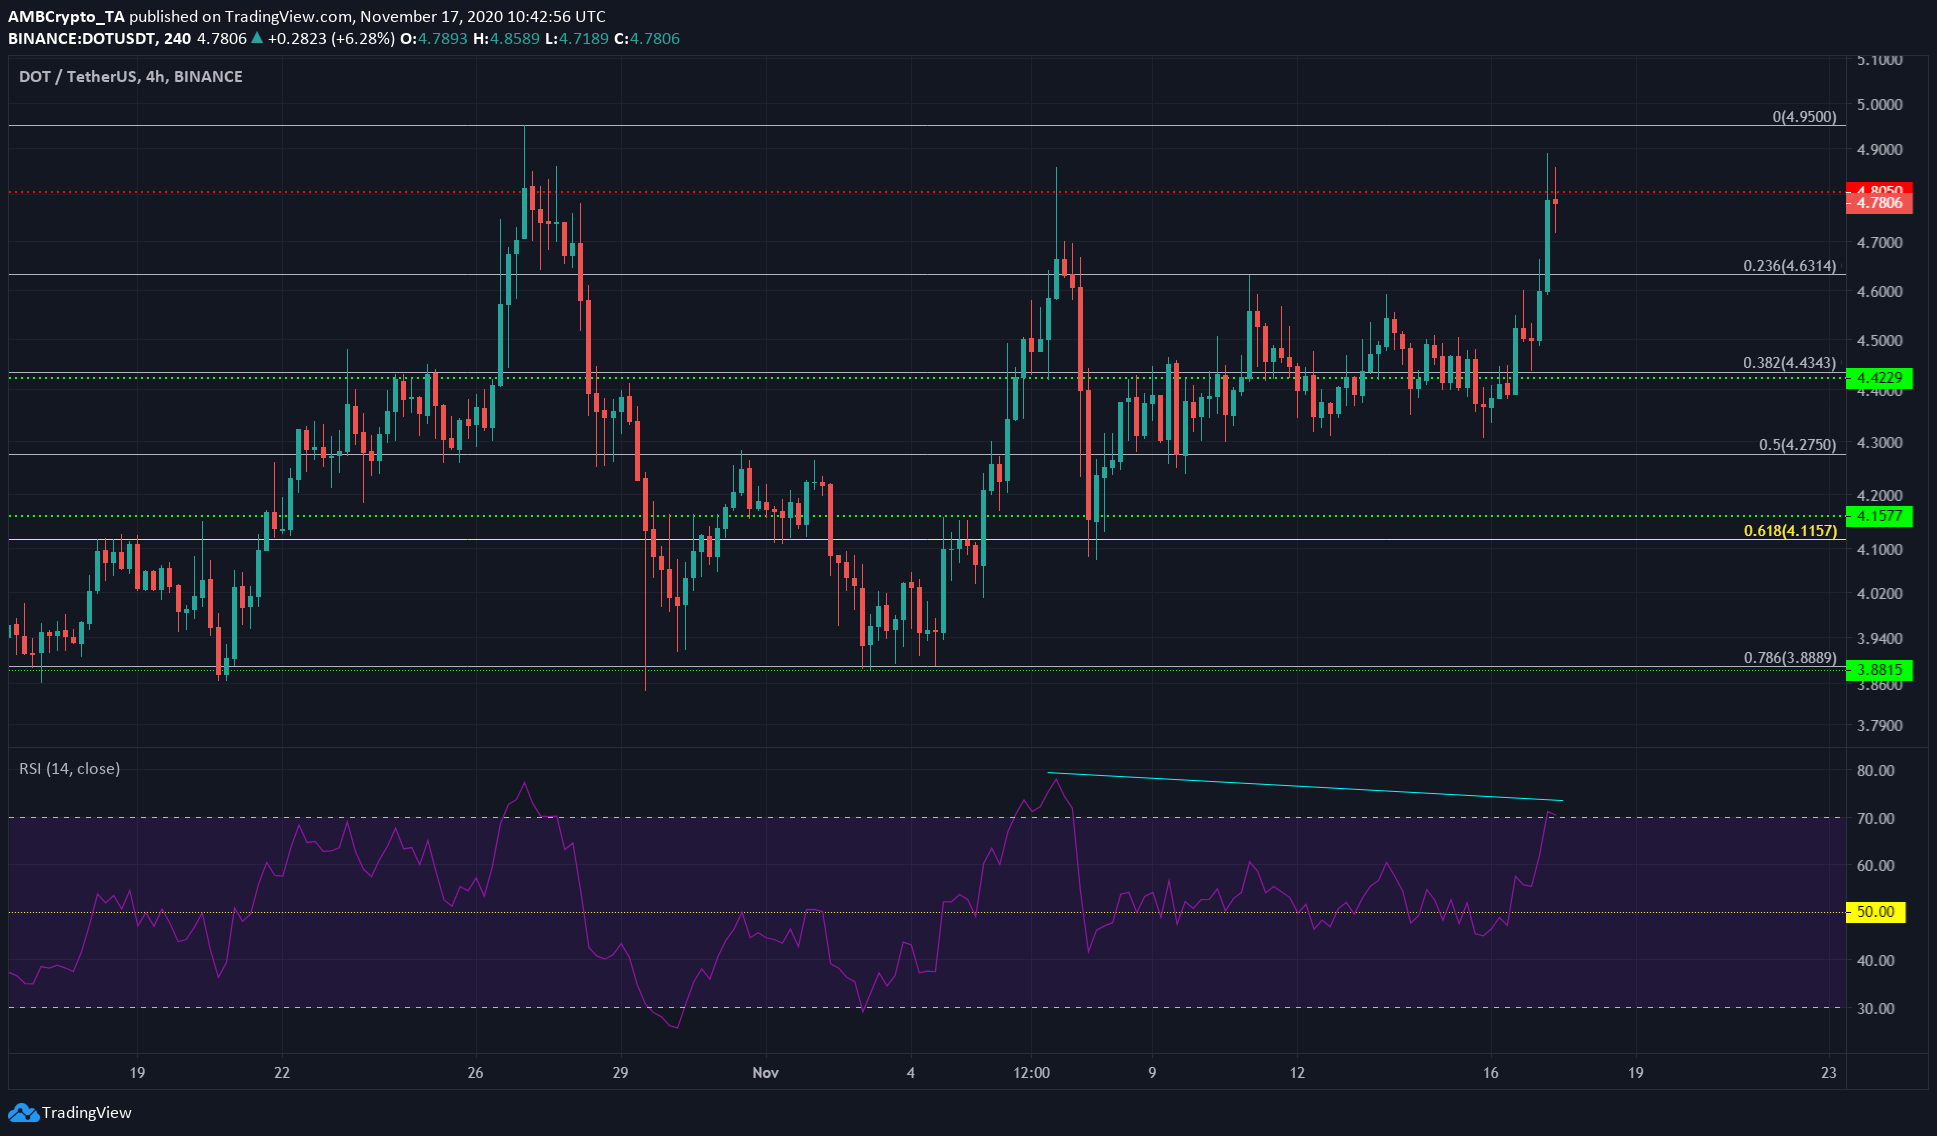
Source: DOT/USDT on TradingView
Polkadot showed a bearish divergence on the 4-hour charts as the price approached a level of resistance at $4.8. However, this development was not necessarily an announcement of an immediate drop in price.
A close above the resistance level could see further gains made before a pullback, while a rejection at resistance could see DOT drop to $4.63, the 23.6% Fibonacci retracement level of DOT’s move from $3.6 to $4.95.
DOT has been bullish since it climbed past $4.15, but it remains to be seen if it has the legs to scale $5 resistance in the coming days. What is more certain is that DOT is due for a pullback.
IOTA
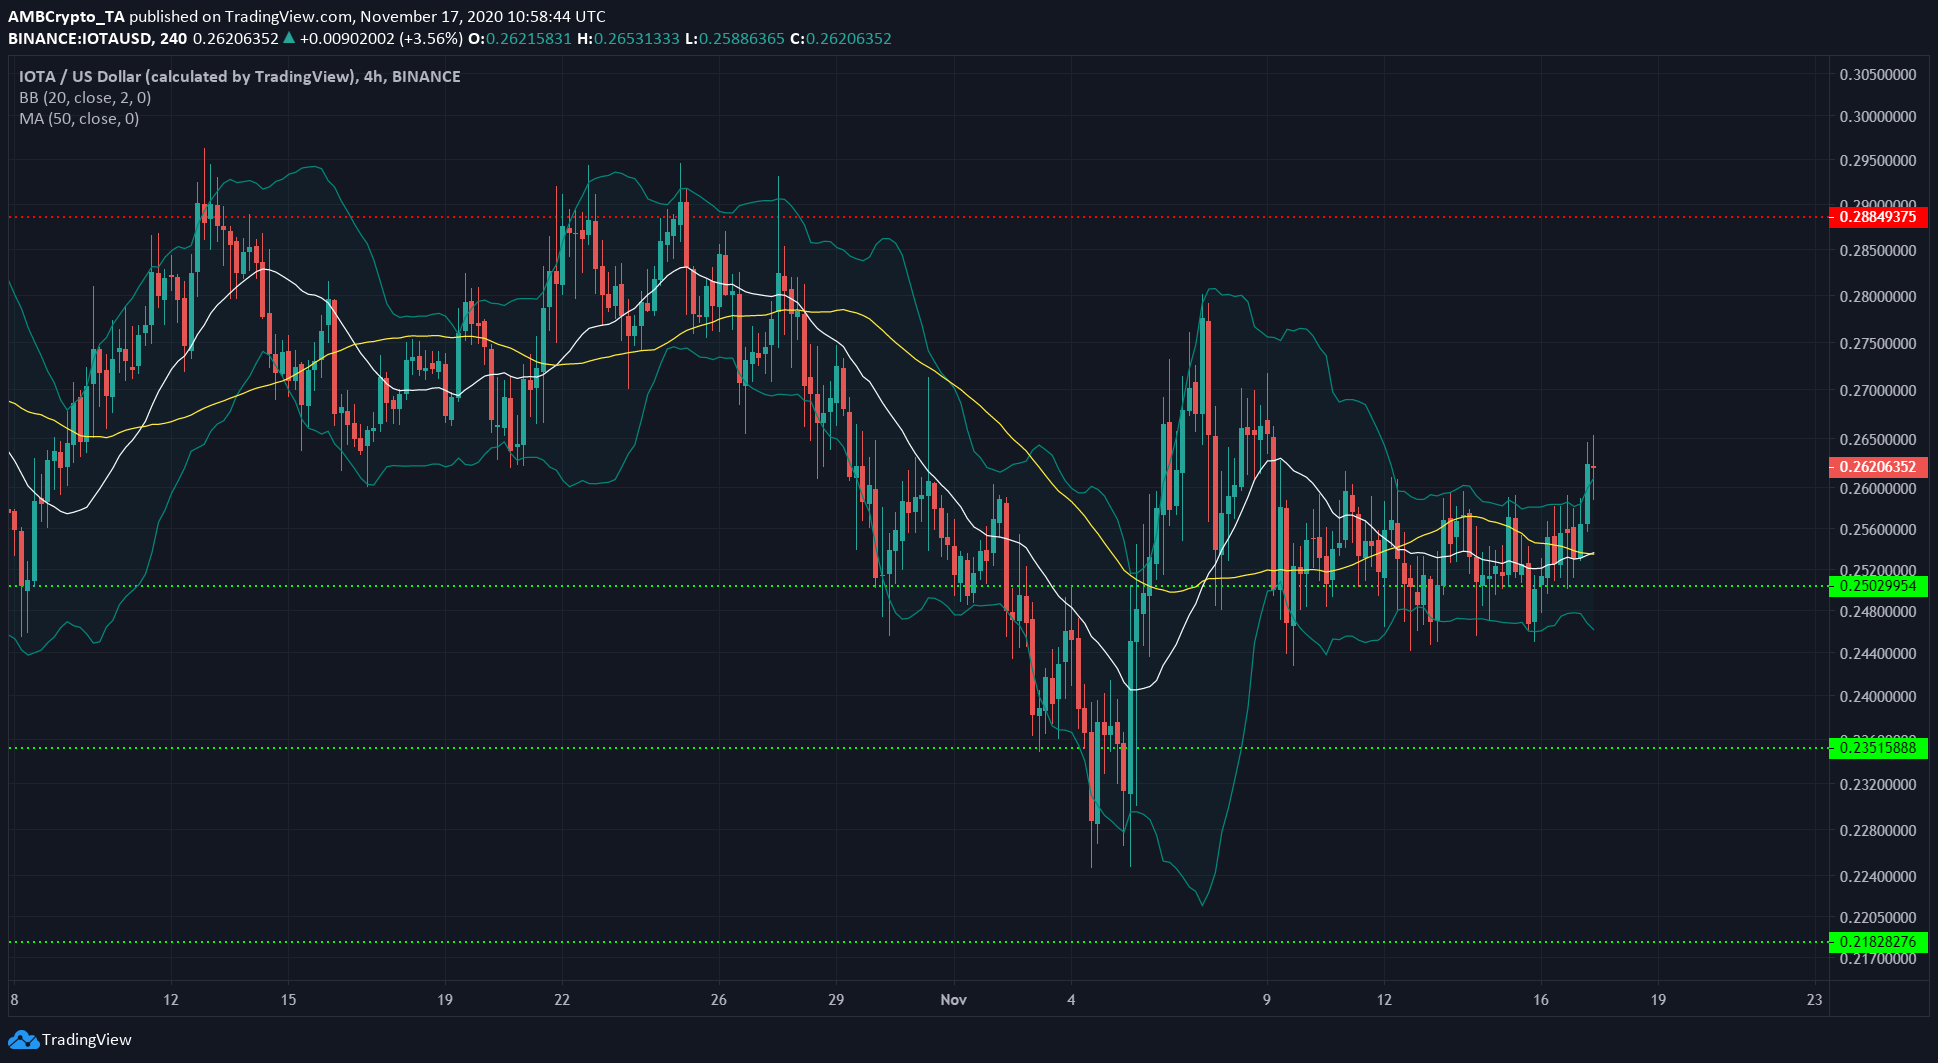
Source: IOTA/USD on TradingView
The Bollinger bands were relatively stable around IOTA’s price in the past few days. But at the time of writing, the price appeared to be breaking out upward.
The bands were beginning to expand to indicate volatility in the market as IOTA, which had been trading sideways at $0.25 support, registered some gains.
The 20-period moving average (white) was on the verge of crossing above the 50 SMA (yellow), and could serve as support for the coin in the coming days.
The $0.272 level could offer some resistance to IOTA’s ascent toward a level of resistance at $0.288.
Algorand [ALGO]
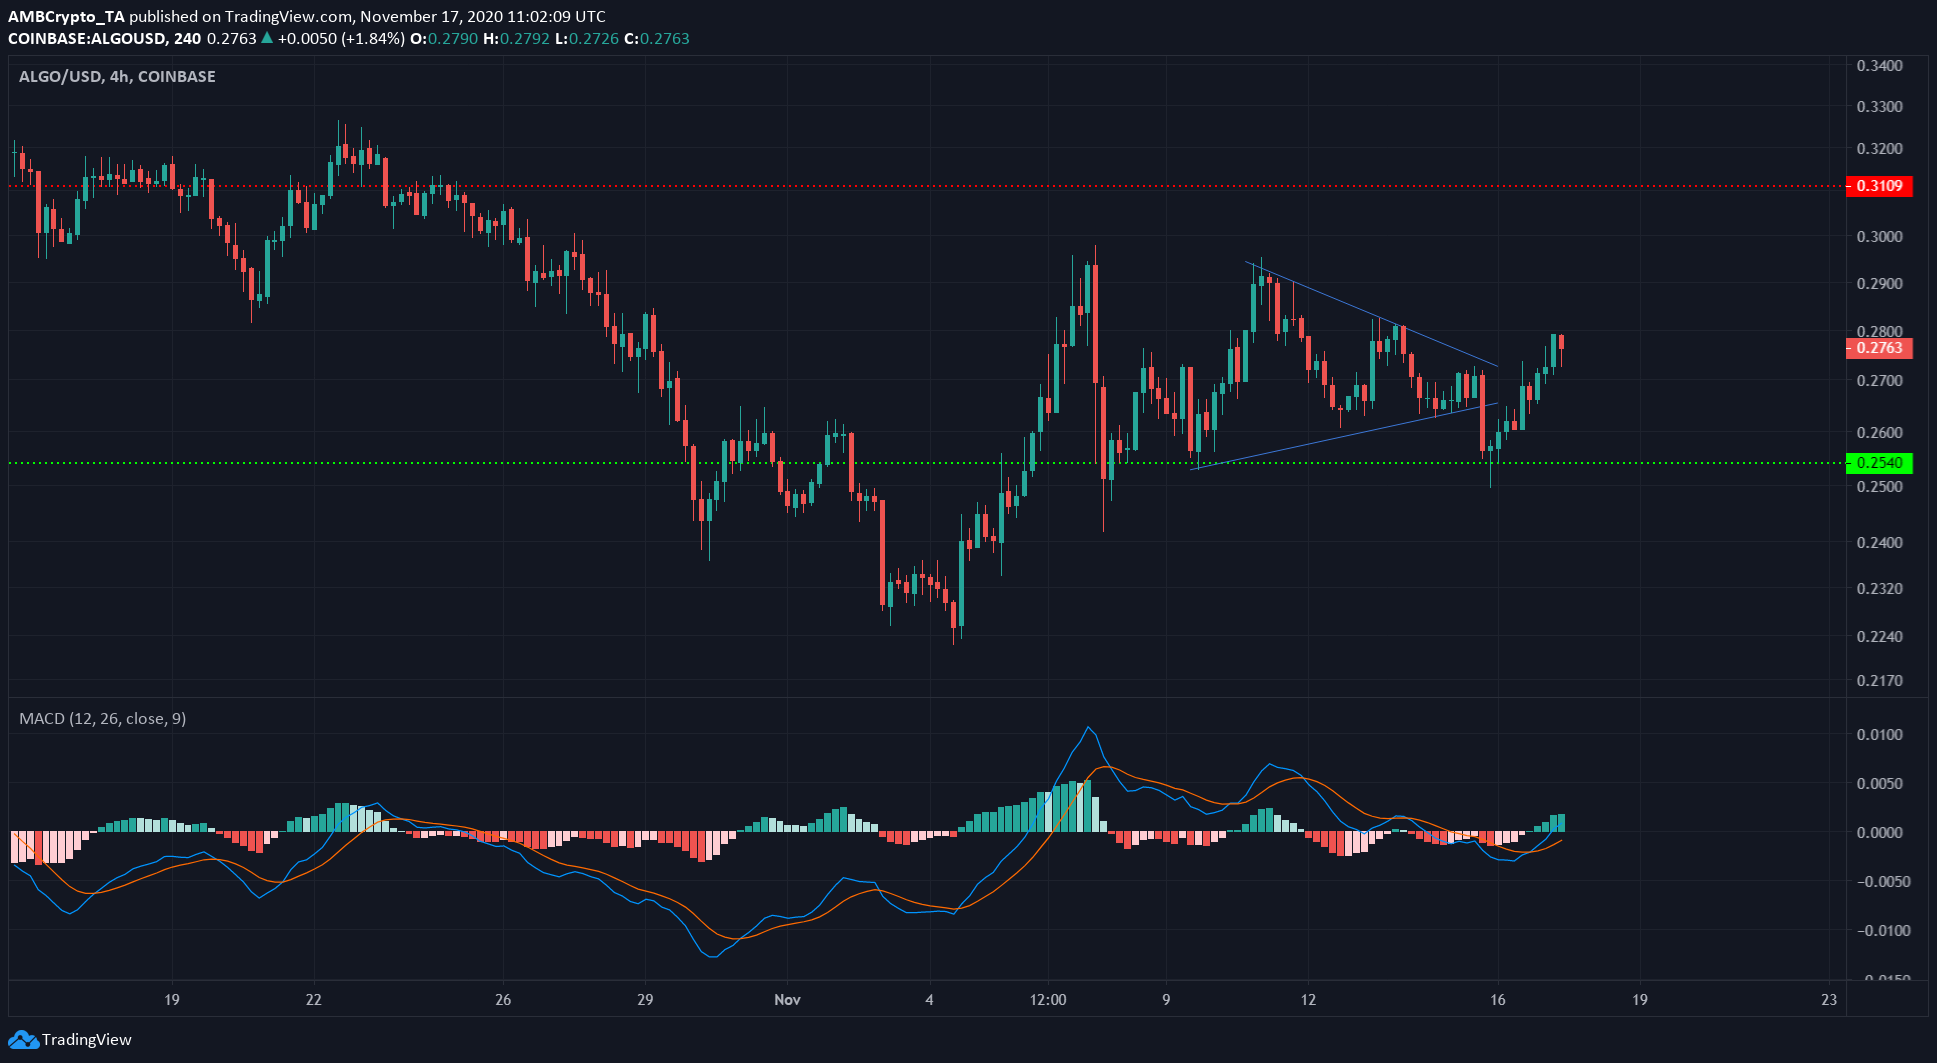
Source: ALGO/USD on TradingView
Algorand formed a symmetrical triangle (blue) and closed beneath the pattern to signal a drop in price. It found support at the $0.25 level and bounced strongly upward.
The MACD formed a bullish crossover beneath the zero line and was headed back upward, a sign of rising bullish momentum.
If ALGO closed a session above the most recent highs at $0.29, it was likely to test resistance at $0.31 soon.
The post appeared first on AMBCrypto


