
- XRP continues to maintain the $0.227 support as it recently made attempts to break $0.24.
- The cryptocurrency has lost a total of 15% over the past two weeks of trading but is doing well to remain above the $0.227 support.
- Against Bitcoin, XRP is struggling to break resistance at 2700 SATs.
Key Support & Resistance Levels
Support: $0.227, $0.22, $0.217.
Resistance: $0.245, $0.25, $0.26.
Support: 2640 SAT, 2600 SAT, 2550 SAT.
Resistance: 2700 – 2710 SAT, 2750 SAT, 2800 SAT.
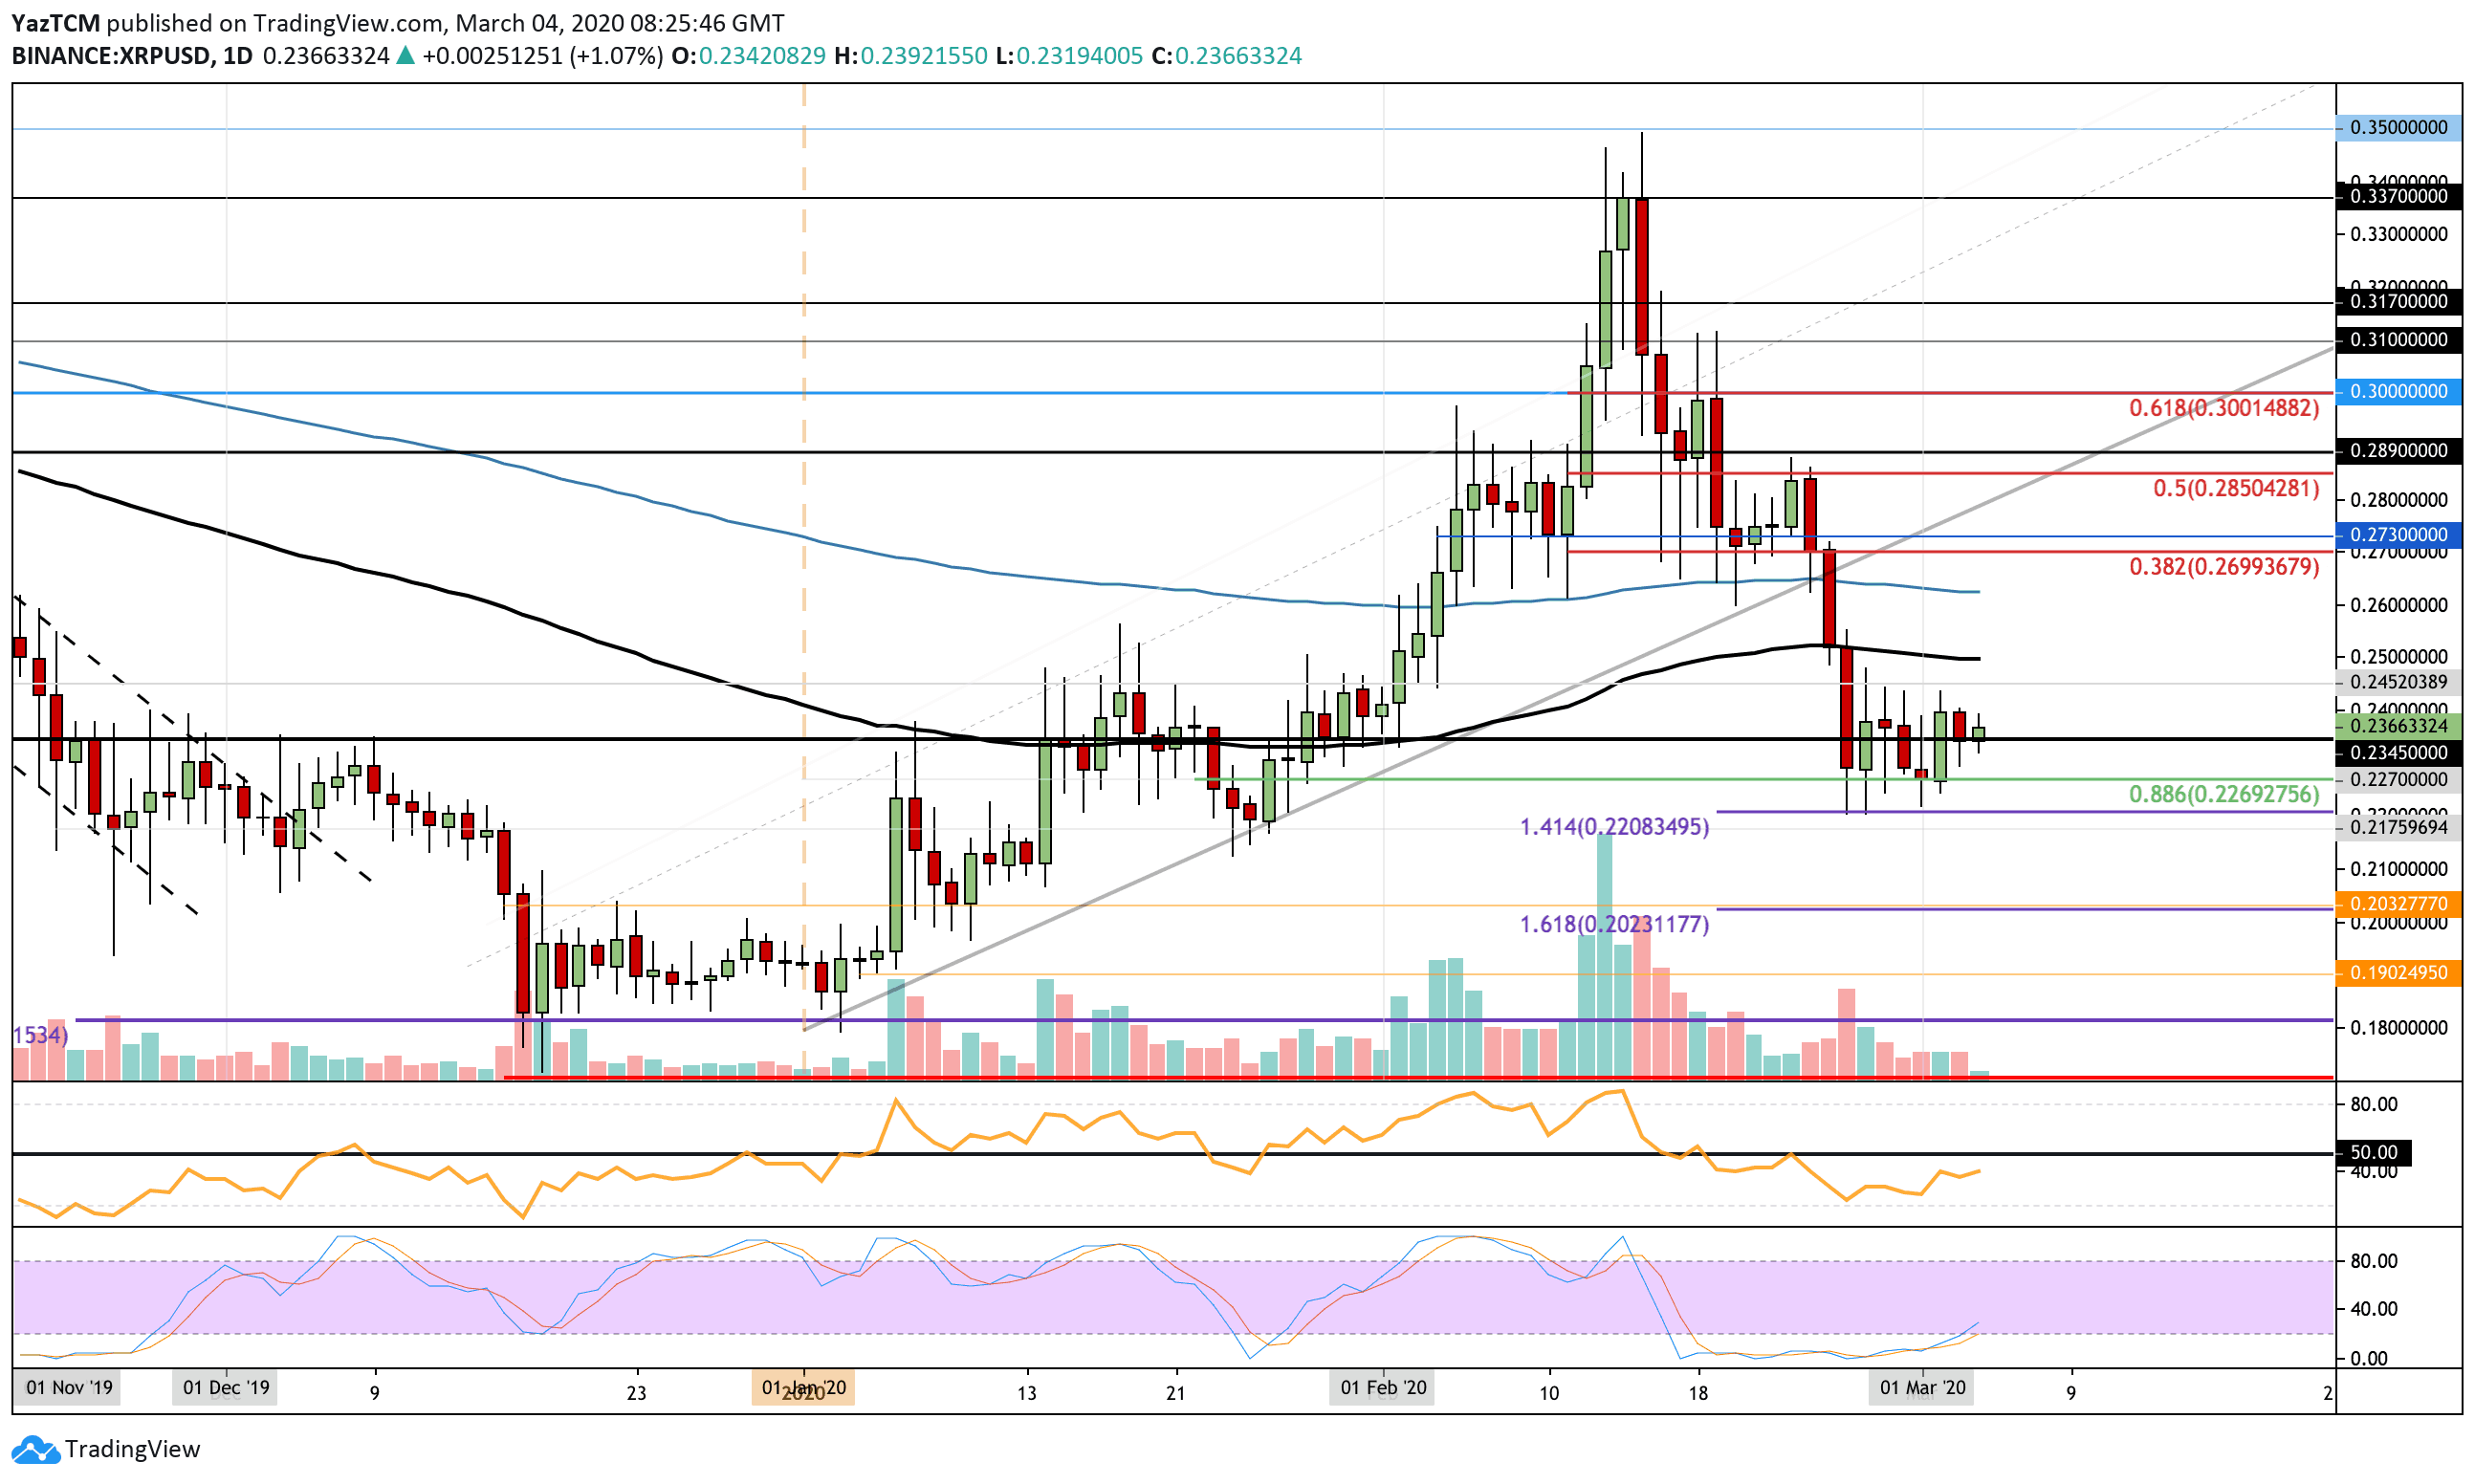
XRP/USD – Ripple Continues To Hold The 0.886 Fib Support.
Since our last analysis, XRP bounced from the support at $0.227, provided by the .886 Fibonacci Retracement level, as it increased higher into resistance at $0.24.
The cryptocurrency is now trading within a wide range between $0.22 and $0.245, and a break out of the range is likely to signal the next short-term for XRP.
The trading volume seems to be fading, which could be a positive sign that the selling pressure is dropping, and a significant move might be imminent.
XRP Short Term Price Prediction
If the buyers break above $0.24 and the upper boundary of the mentioned range, the first level of resistance lies at $0.25 (100-days EMA). This is followed by resistance at $0.26 (200-days EMA), and $0.27 (the bearish .382 Fib Retracement).
On the other hand, if the sellers push XRP beneath $0.235, support can be found at $0.227. This is followed by further support at $0.22 and $0.217.
The RSI is rising toward the 50 level, which is a sign that the selling momentum is fading. It would need to break above for any form of bullish recovery. Additionally, the Stochastic RSI is in the process of producing a bullish crossover signal.
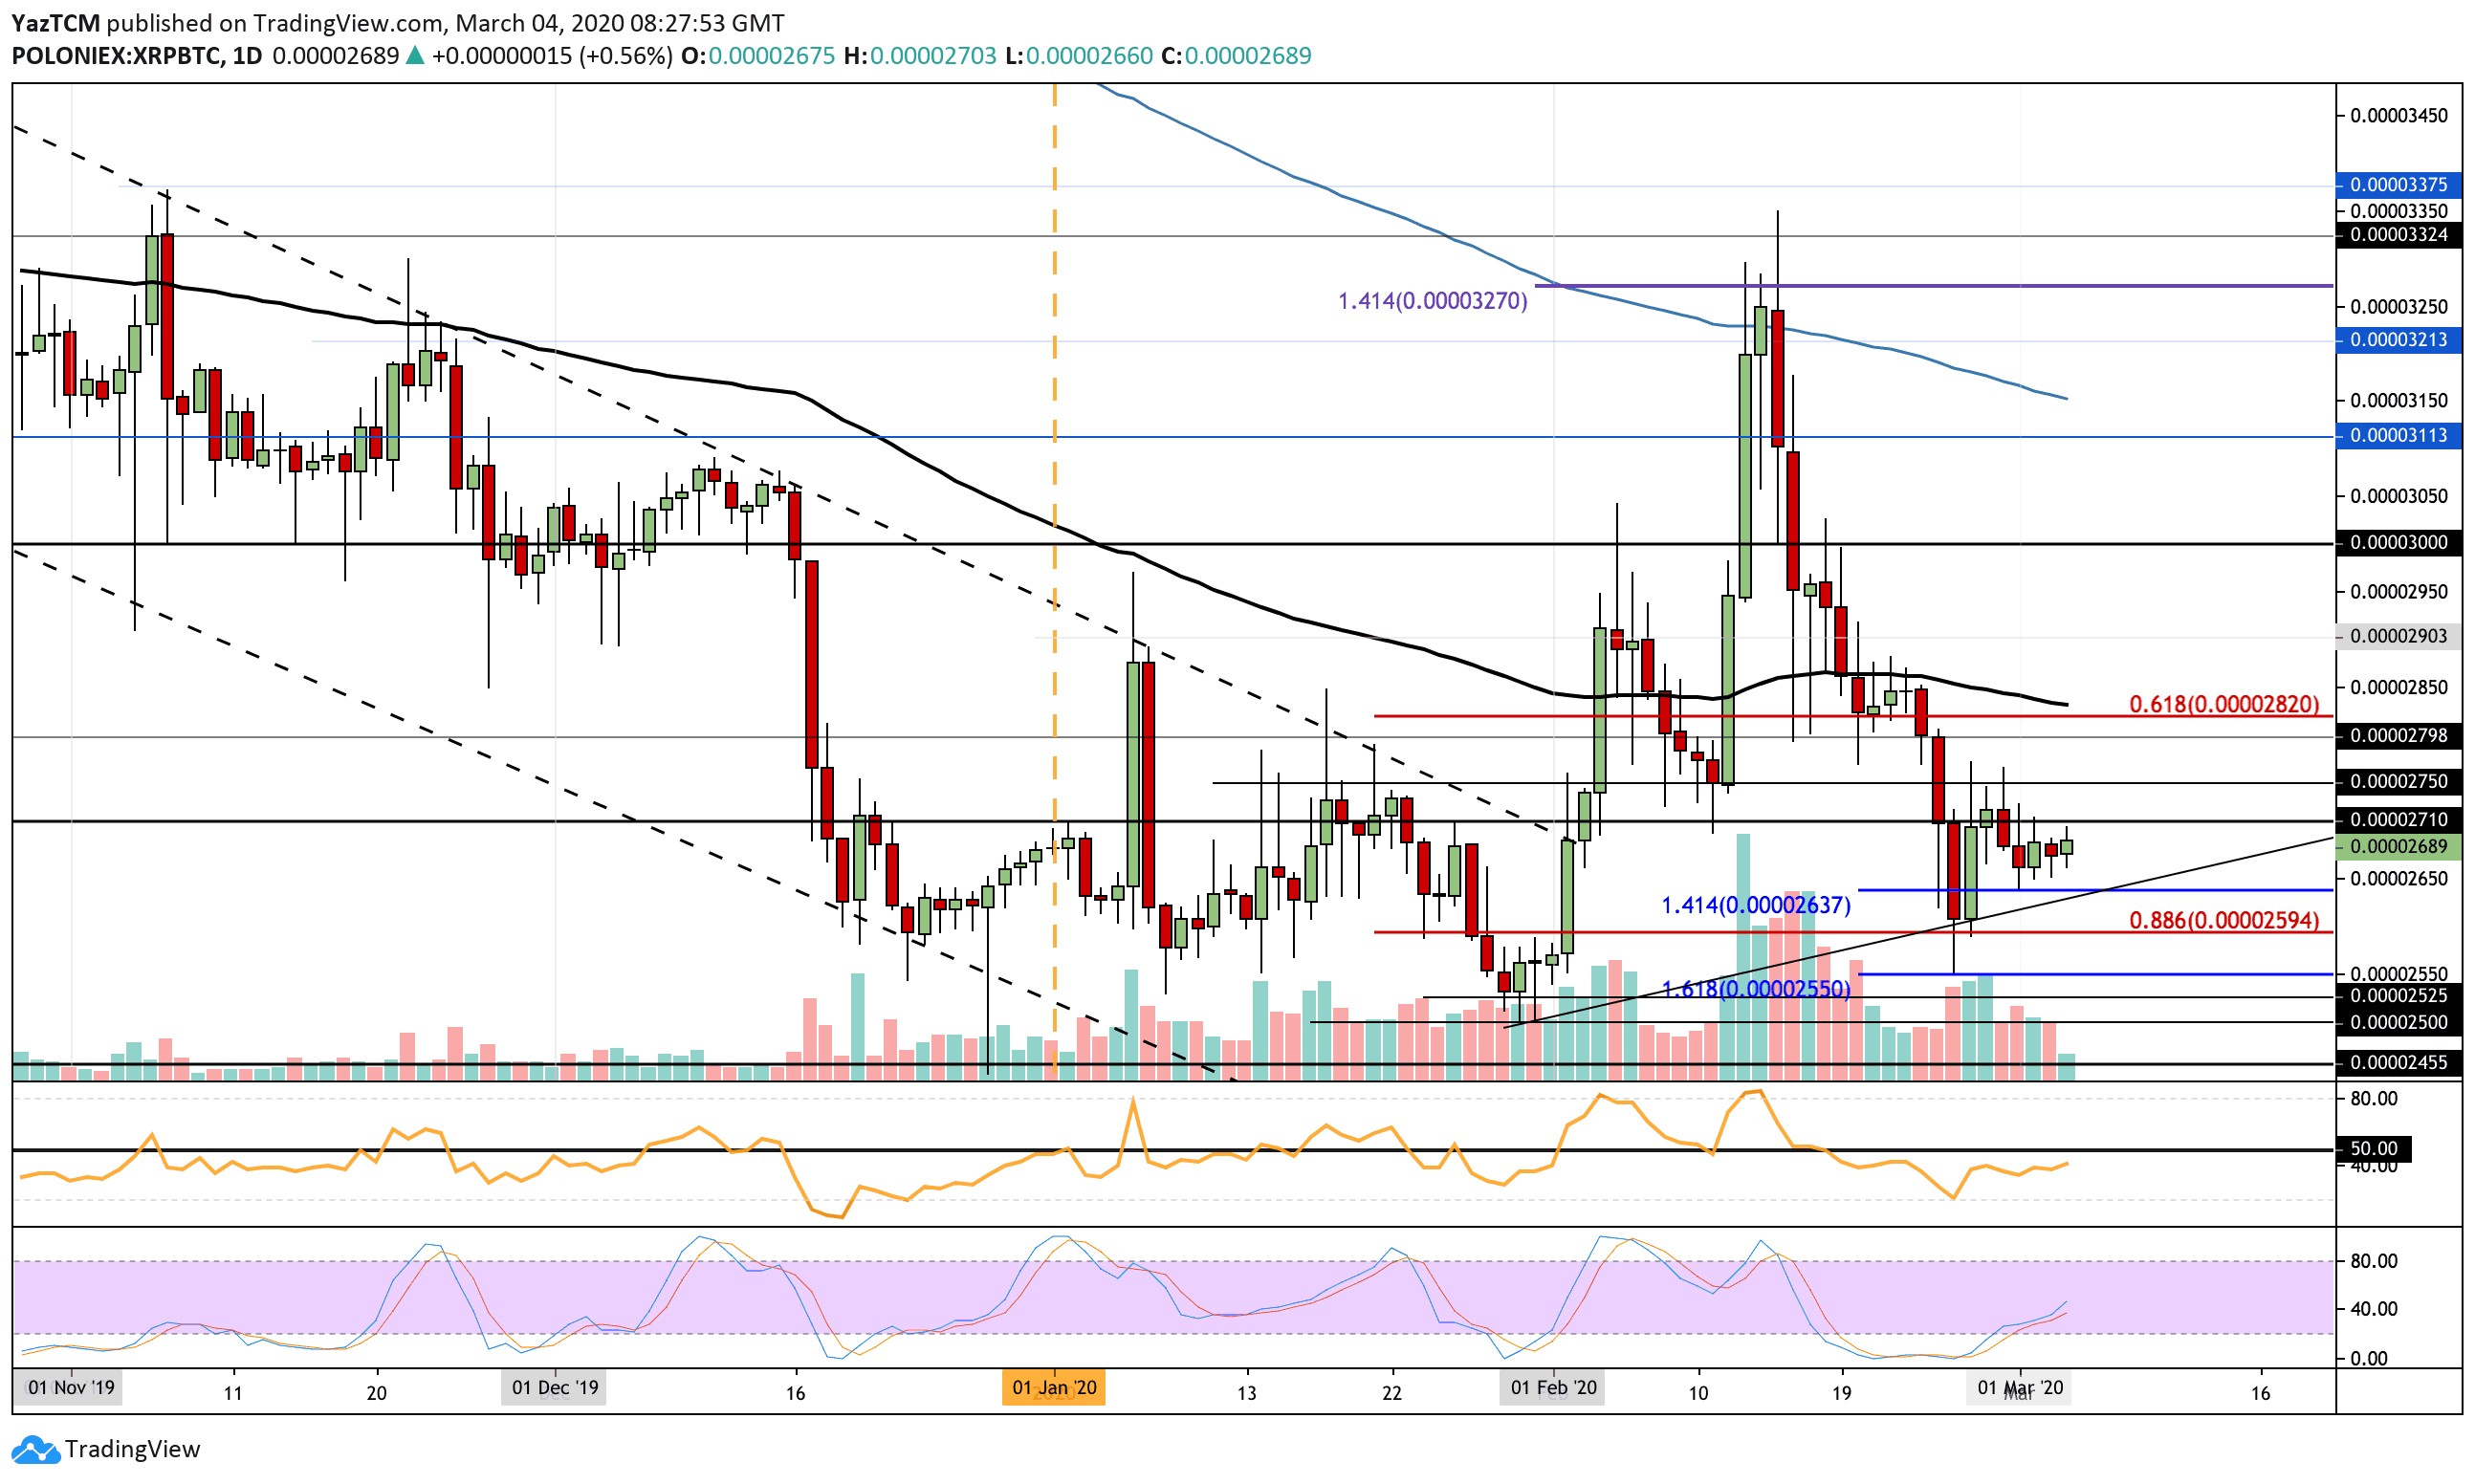
XRP/BTC – Ripple Finding Resistance at 2710 SAT.
XRP managed to rebound from the support at 2640 SAT over the past few days; however, it is struggling to climb above 2710 SAT.
The cryptocurrency is now trading in a period of consolidation and must break 2750 SAT before we could consider any move higher. If it were to break beneath the short term rising trend line, the market would be in danger of turning bearish.
XRP Short Term Price Prediction
In the case of a break above 2710 SAT, further resistance is located at 2750 SAT and 2800 SAT. This is followed by resistance at 2840 SAT (100-days EMA) and 2900 SAT.
On the other hand, if the sellers push lower, support can be found at 2640 SAT (downside 1.414 Fib Extension). This is followed by support at 2600 (.886 Fib Retracement) and 2550 SAT (downside 1.618 Fib Extension).
The RSI is also edging closer to the 50 levels as the buyers attempt to regain control over the market momentum. The Stochastic RSI produced a bullish crossover signal toward the end of February that allowed XRP/BTC to rebound from the 2595 SAT’s level.
The post Ripple Price Analysis: Past Week’s Sideways Action Might End-up In A Huge XRP Move Soon appeared first on CryptoPotato.
The post appeared first on CryptoPotato


 Capital Inflows Pales in Comparison to Bitcoin (BTC)")