
XRP has seen a sharp decrease of 10.49% over the previous week, bringing its price to $0.2566. The cryptocurrency lost 21% over the past 30 days and 37% over the past 3 months.
XRP remains the third-largest cryptocurrency with a market cap of $11.07 billion.
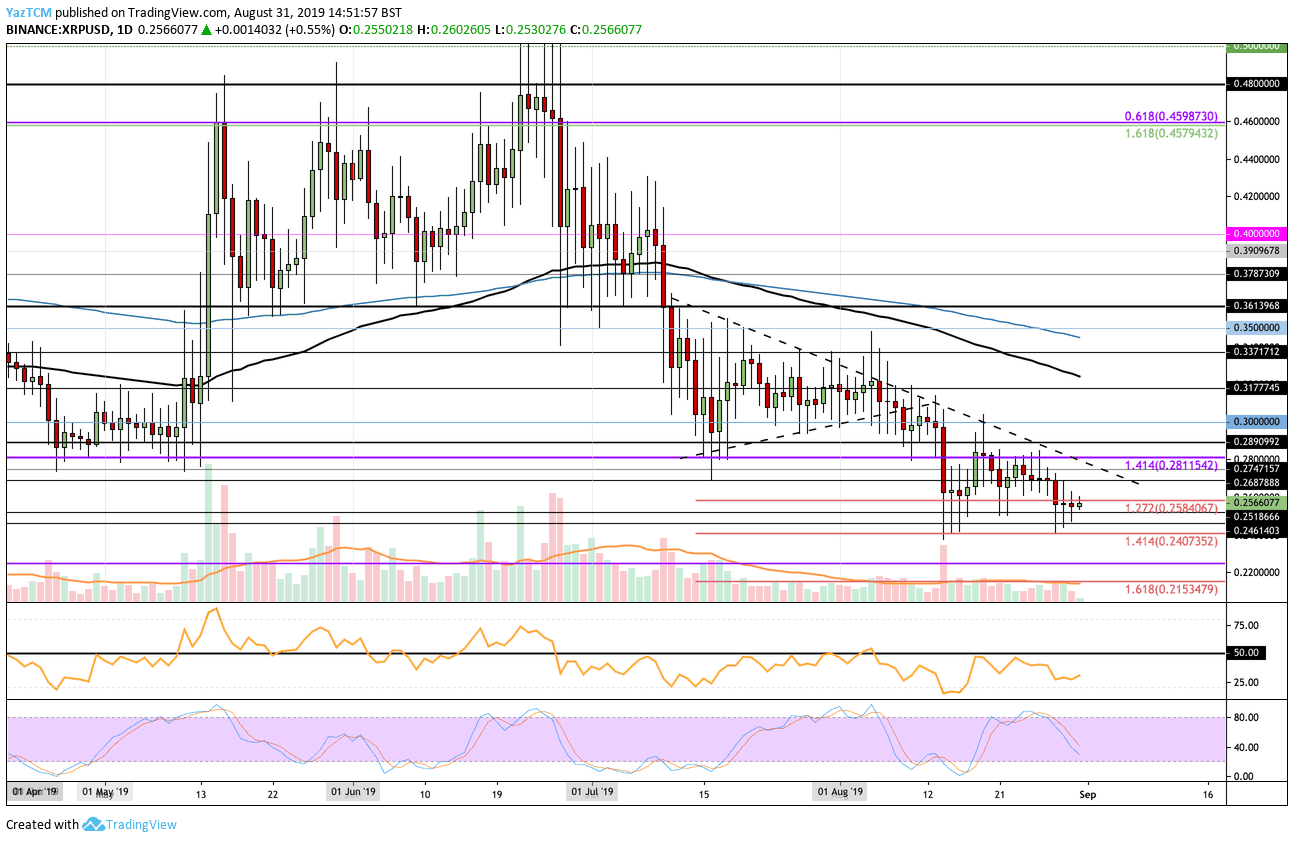
Looking at the XRP/USD 1-Day Chart:
- Since our previous XRP/USD analysis, XRP continued to trade above the low at $0.24. However, it started to create fresh lows beneath the support at $0.2584 which could be a sign that XRP is ready to head even lower.
- From above: The nearest level of resistance lies at $0.2584. Above this, resistance is located at $0.26, $0.2687, $0.2747, and $0.2811. For XRP to turn bullish in the short term, we will need to see it climbing above $0.30. After that, resistance is found at $0.32 (100-days EMA) and $0.33.
- From below: The nearest level of support lies at $0.2518 and $0.25. Beneath this, support is located at $0.2461 and $0.2402. If the selling continues, support is expected at $0.23, $0.225, and $0.2153.
- The trading volume remains low and beneath the average level.
- The RSI is in favor of the bears as they continue to dominate the market momentum.
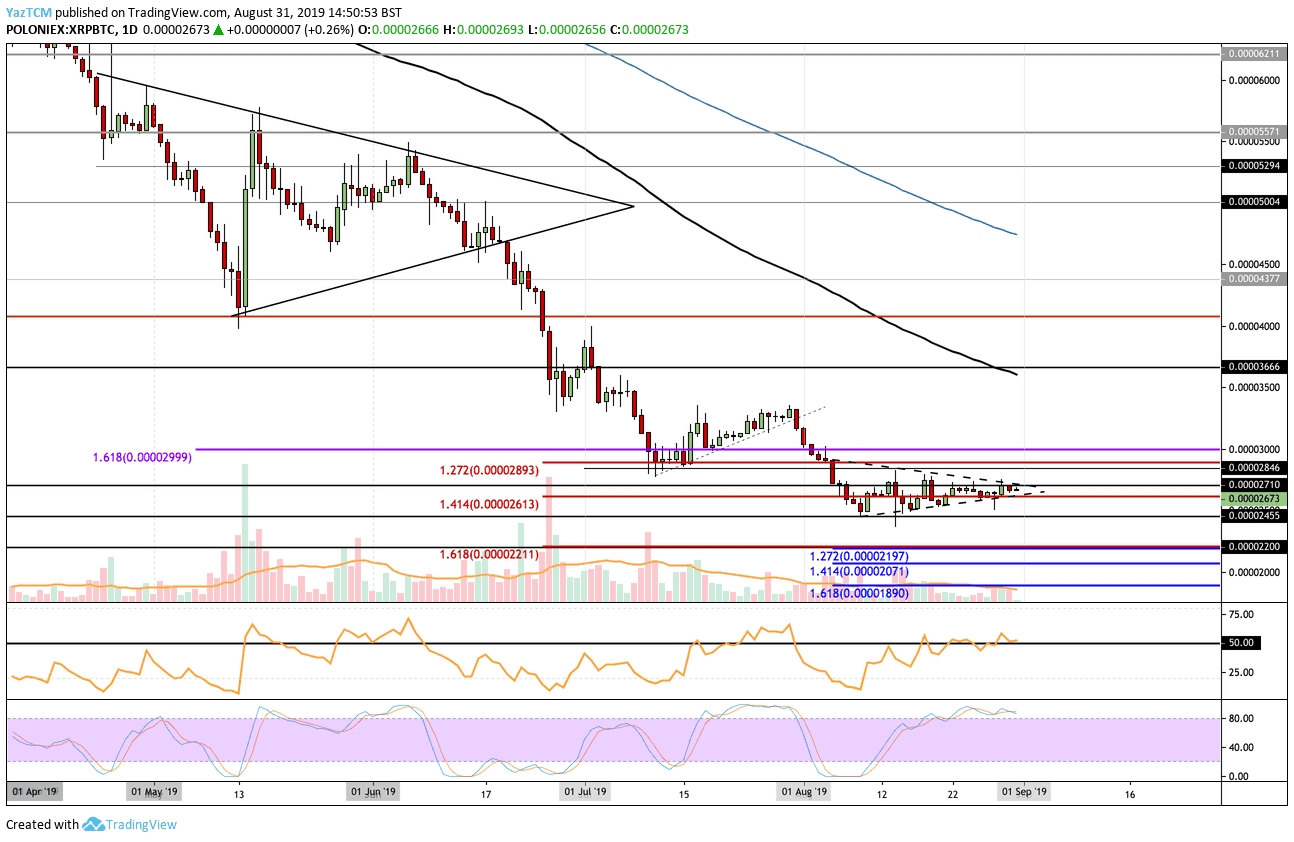
Looking at the XRP/BTC 1-Day Chart:
- Against Bitcoin, we can see that XRP is holding remarkably well in the range between 2455 SAT and 2800 SAT. The coin has created a very acute symmetrical triangle as the cryptocurrency continues to consolidate.
- From above: The nearest level of resistance is at 2710 SAT and 2800 SAT. Above this, resistance is to be expected at 2846 SAT, 3000 SAT, and 3200 SAT. The 100-days EMA is located at 3600 SAT.
- From below: The nearest level of support lies at 2613 SAT which is followed with support at the lower boundary of the range at 2455 SAT. Beneath this, support can be found at 2400 SAT, 2300 SAT, 2211 SAT, and 2071 SAT.
- The trading volume remains low but is showing signs of increase over the past few days.
- The RSI has recently managed to break above the 50 level which shows that the bulls are attempting to gain control over the market momentum. However, the Stochastic RSI is currently trading at extreme overbought levels as we wait for a bearish crossover that could push the market lower.
Be the first to know about our price analysis, crypto news and trading tips: Follow us on Telegram or subscribe to our weekly newsletter.
More news for you:
By Yordan Lyanchev / Aug 31, 2019
By Yaz Sheikh / Aug 30, 2019

By George Georgiev / Aug 30, 2019

By George Georgiev / Aug 30, 2019

By Yaz Sheikh / Aug 29, 2019

By George Georgiev / Aug 29, 2019

By George Georgiev / Aug 29, 2019

By Yuval Gov / Aug 29, 2019

By Yaz Sheikh / Aug 28, 2019

By George Georgiev / Aug 28, 2019

By George Georgiev / Aug 28, 2019

By Yoni Berger / Aug 27, 2019

By Yoni Berger / Aug 27, 2019

By George Georgiev / Aug 27, 2019

By Yordan Lyanchev / Aug 27, 2019
By George Georgiev / Aug 27, 2019
By Yaz Sheikh / Aug 26, 2019

By George Georgiev / Aug 26, 2019
By Yuval Gov / Aug 26, 2019

By George Georgiev / Aug 26, 2019
The post appeared first on CryptoPotato


