
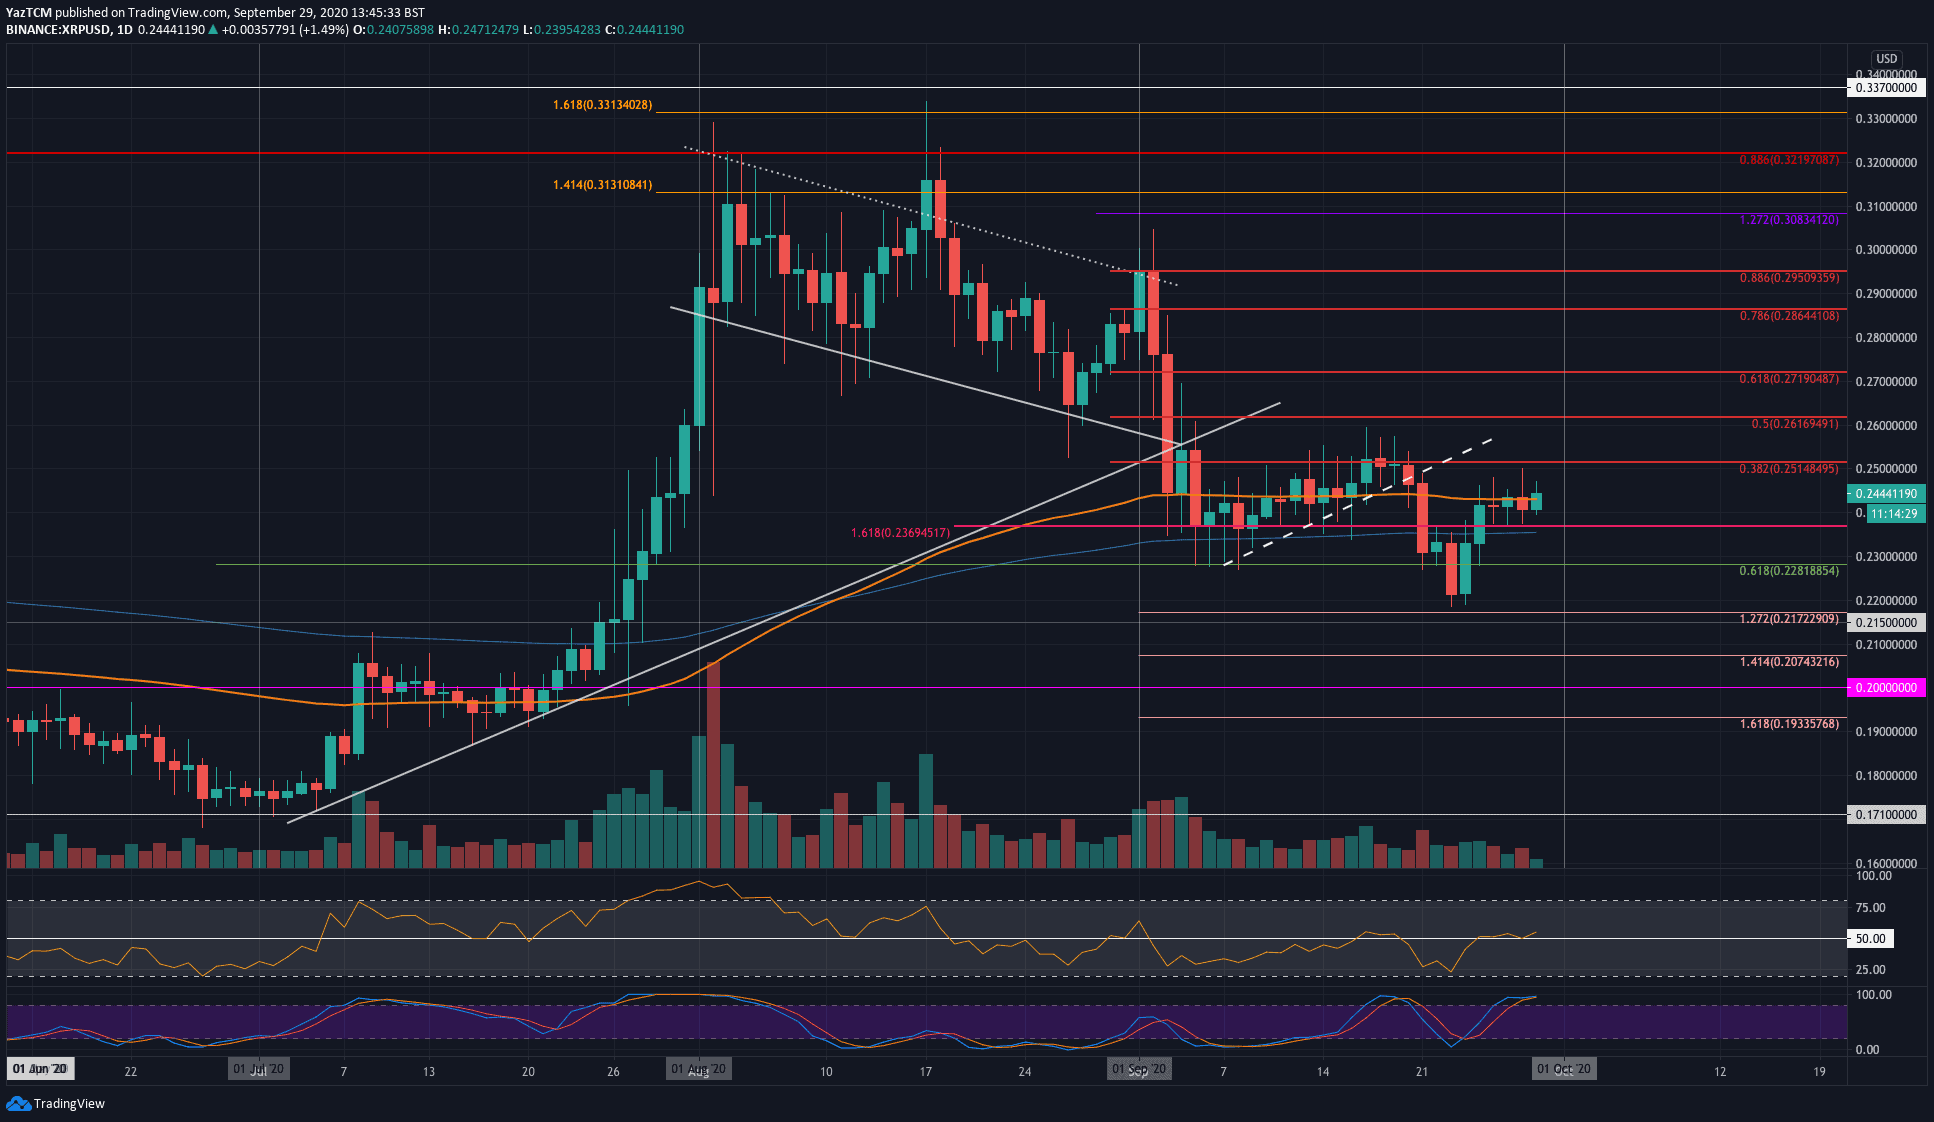
XRP/USD – Bulls Face Tough Resistance at 100-days EMA
Key Support Levels: $0.237, $0.228, $0.22.
Key Resistance Levels: $0.251, $0.261, $0.271.
XRP dropped beneath the .618 Fib at $0.228 last week but managed to find reliable support at the $0.22 level. From there, it rebounded as it pushed back above the 200-days EMA to reach the current $0.244 resistance.
Over the past five days, XRP has struggled to close the daily candle above the 100-days EMA. It has remained supported at $0.237 during this time but must pass the 100-days EMA to continue higher. It has spiked above it to reach $0.25, but the sellers always managed to bring the price lower to close beneath the 100-days EMA.
Today, the bulls are above this resistance; however, the daily candle must close to act as a confirmation.
XRP-USD Short Term Price Prediction
If the buyers close above the 100-days EMA, the first level of resistance lies at $0.251 (bearish .382 Fib Retracement). Above this, resistance lies at $0.261 (bearish .4 Fib Retracement), and $0.271 (bearish .618 Fib Retracement).
On the other side, the first level of support lies at $0.237 (200-days EMA). Beneath this, additional support lies at $0.228 (.618 Fib Retraeacement), $0.22, and $0.217.
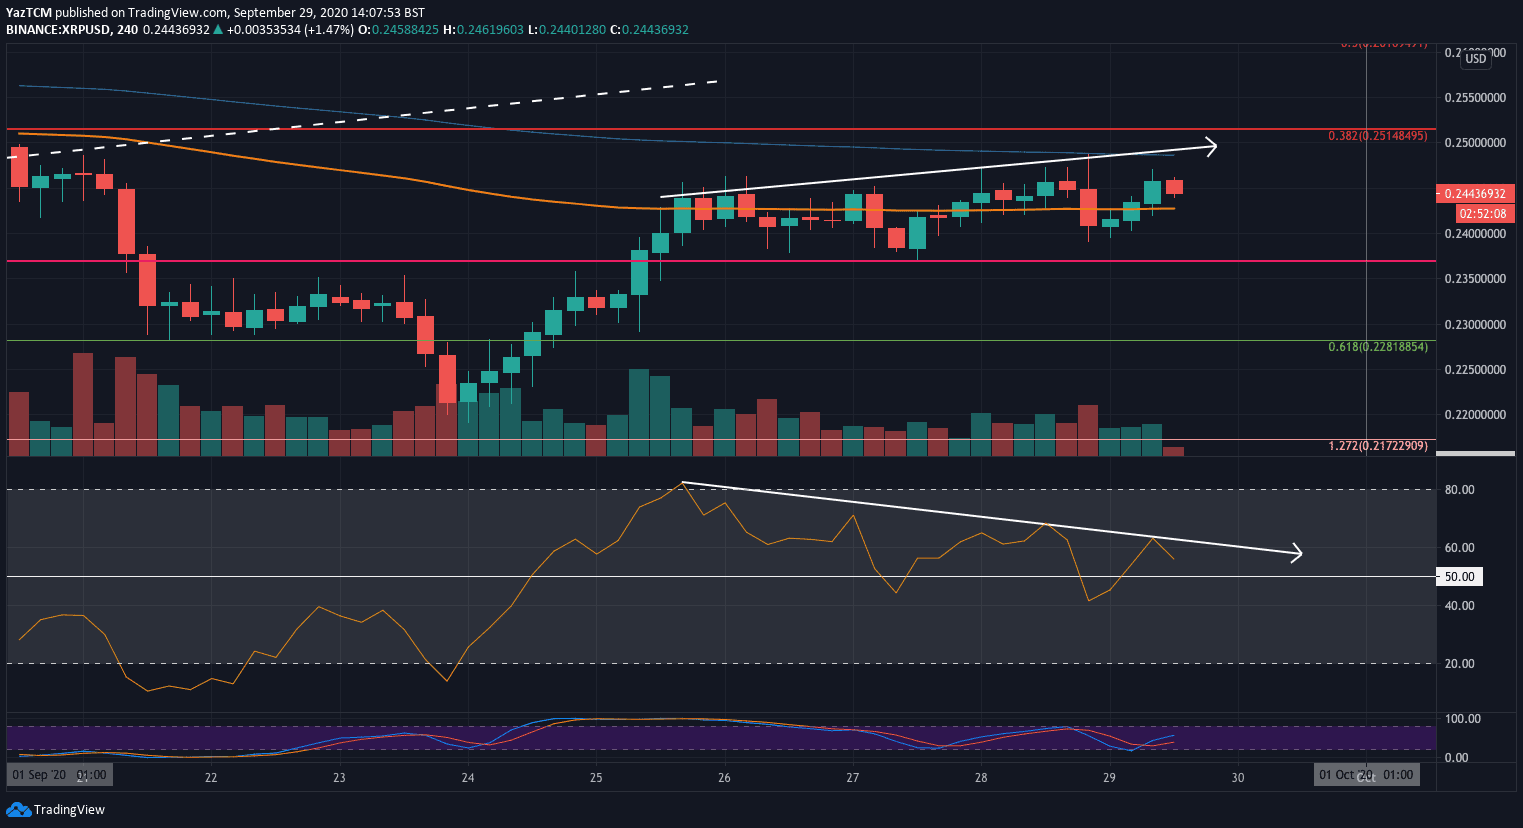
The Stochastic RSI is in overbought conditions right now, and a bearish crossover signal could send the market lower. Additionally, on the following 4HR chart, there are signs of bearish divergence forming, which could be a potentially bearish signal;
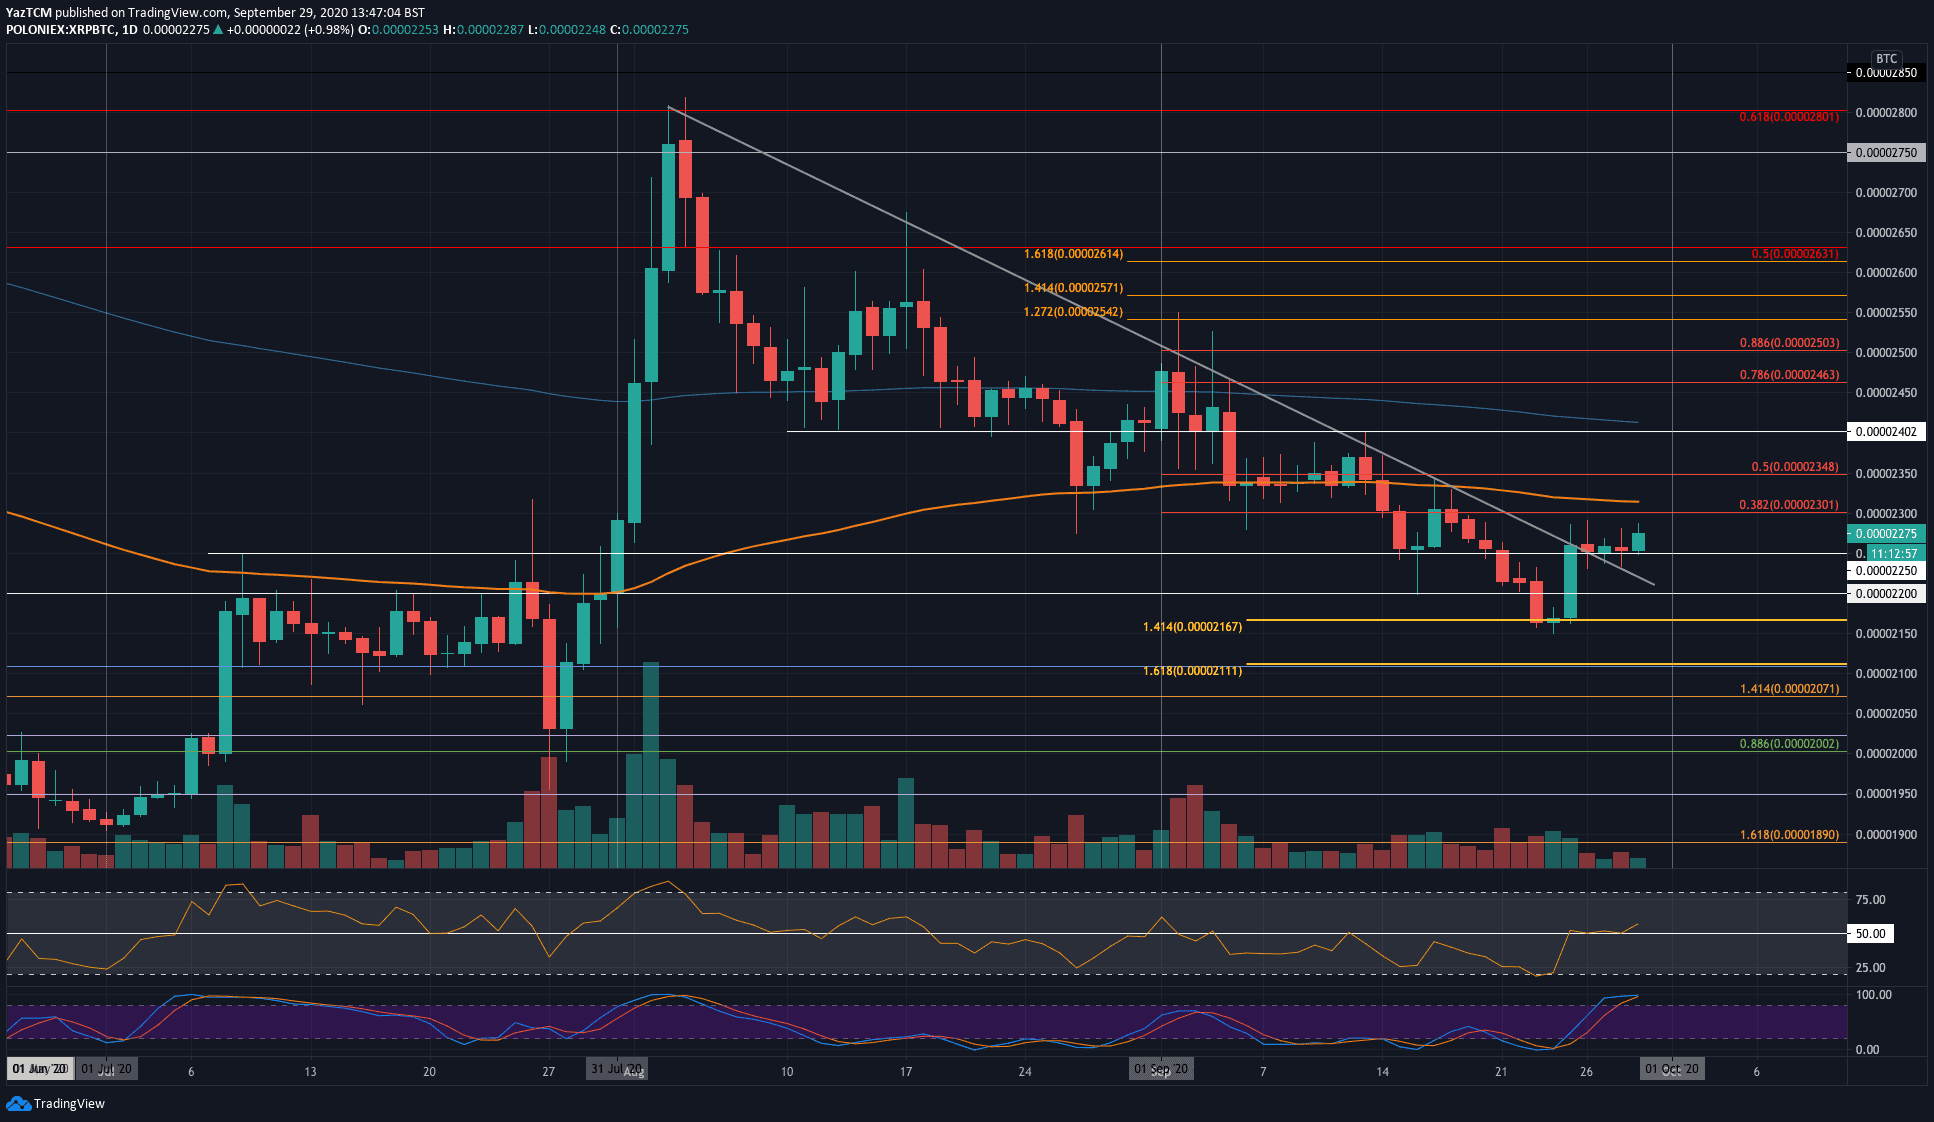
XRP/BTC – Bulls Penetrate 2-month-old Falling Trend Line
Key Support Levels: 2250 SAT, 2200 SAT, 2150 SAT.
Key Resistance Levels: 2300 SAT, 2350 SAT, 2400 SAT.
XRP rebounded from the support at 2150 SAT last week, which allowed it to push into the resistance at a 2-month-old falling trend line. Over the weekend, XRP moved sideways, which caused the coin to break above the falling trend line.
This is a very bullish signal for XRP holders as the downtrend could be over. However, it is essential to note that this does not mean that XRP will turn bullish as the market can move sideways in consolidation.
Today, the bulls have pushed higher as they make their way toward the 2300 SAT level.
XRP-BTC Short Term Price Prediction
The first level of resistance to break lies at 2300 SAT (bearish .382 Fib Retracement). The 100-days EMA lies slightly above this level, adding to the resistance. Beyond the 100-days EMA, additional resistance lies at 2350 SAT (bearish .5 Fib Retracement), and 2400 SAT (200-days EMA).
On the other side, the first level of support lies at 2250 SAT. Beneath this, support is found at 2200 SAT and 2150 SAT.
Likewise, the Stochastic RSI is also overbought and is primed for a bearish crossover signal, which could send the market lower.
Click here to start trading on BitMEX and receive 10% discount on fees for 6 months.
Disclaimer: Information found on CryptoPotato is those of writers quoted. It does not represent the opinions of CryptoPotato on whether to buy, sell, or hold any investments. You are advised to conduct your own research before making any investment decisions. Use provided information at your own risk. See Disclaimer for more information.
The post appeared first on CryptoPotato


