
- XRP trades in a rising channel as buyers wait for a bounce.
- The third-largest crypto is currently down by 0.24%.
- XRP is footing a bearish sentiment across its trading pairs.
XRP/USD: XRP Showing Bearish Sign But Channel Keeps Buyers Valid
Key Support Levels: $0.23, $0.225
Key Resistance Levels: $0.24, $0.251
Following last weekend’s sharp drop to $0.225, Ripple’s XRP has seen a mild recovery to around $0.24 over the last 48-hours. But at the time of writing, XRP is showing weakness with about 0.57% losses. The trading volume has also dropped to around $1.584 billion at the moment.
Technically, the XRP supply appeared to be turning heavy. If statistics continue to gauge weakness in price and volume, we can expect the sellers to reiterate the sharp move that we saw over last weekend. This scenario could cause a notable loss for XRP if sellers step back in the market.
But if the price can maintain the short-term channel pattern, we can expect the price to bounce back. As of now, XRP is technically bullish.
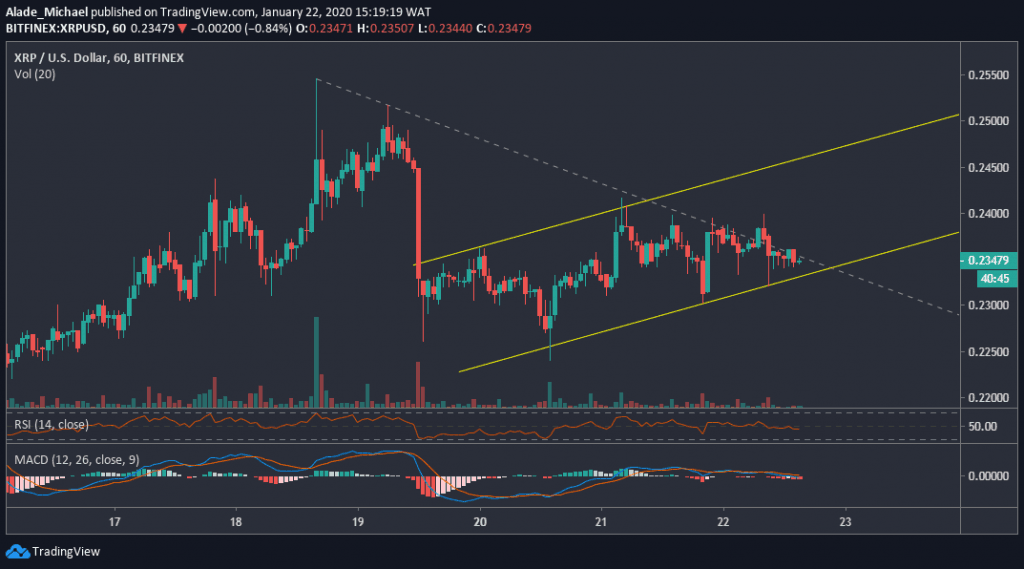
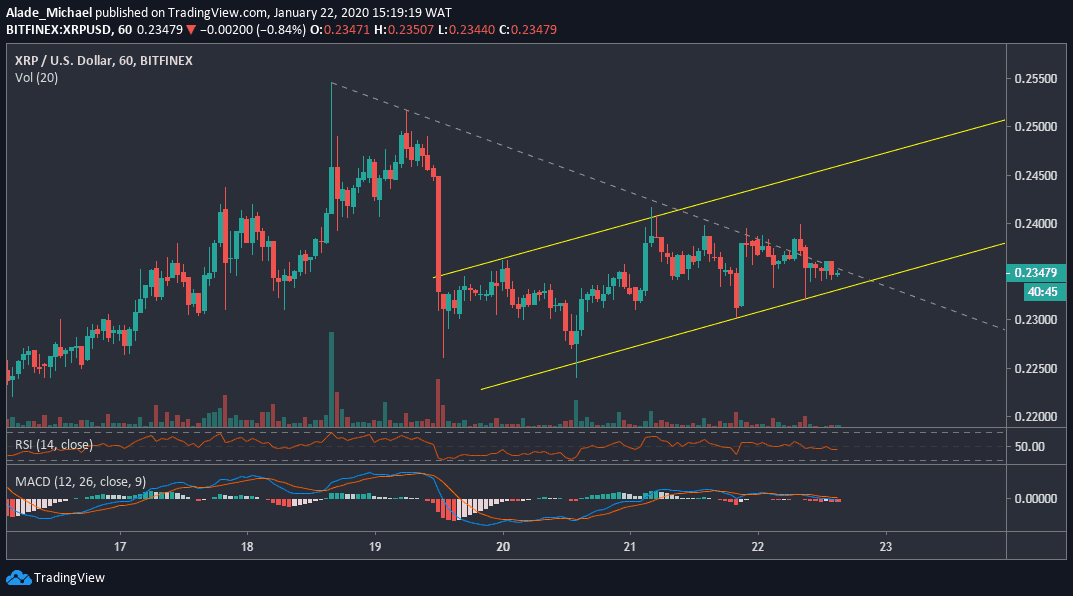
XRP/USD. Source: TradingView
Short-Term Price Analysis
Zooming into the hourly chart, XRP is currently trading in a rising channel that was forming since January 20. The price has reached the channel’s support and, at the same time, respecting the grey-dotted regression line that was drawn from January 18 high. If this channel holds, we should see XRP bouncing back at $0.24 and $0.251 resistance.
A channel breakdown, however, could lead to serious selling pressure in the market. The level of support to watch for such a move is $0.23, followed by $0.225. However, we can see that the RSI and the MACD indicators are looking bearish at the moment. We should expect a sharp move once the price drops.
XRP/BTC: XRP is Waiting For Fractal Move As Bullish Sentiment Remain on Hold
Against Bitcoin, XRP has witnessed a significant increase over the past two weeks of trading. At the time of writing, XRP is trading at around 2712 SAT price level; following a small drop from 2786SAT level today. Meanwhile, the market has been following a bullish sentiment since mid-month.
However, the bullish bias is supported by 2550SAT price levels. XRP is currently sitting at the channel’s support. We can expect the market to keep respecting this rising channel on the four hours chart. If the price fails to respect this channel, XRP is most likely to follow a bearish sentiment.
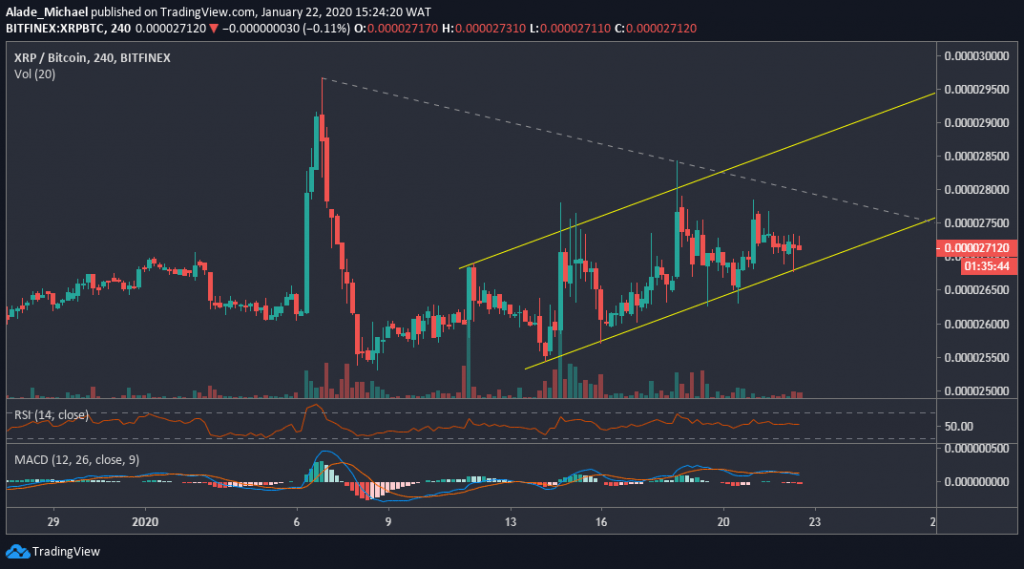
XRP/BTC. Source: TradingView
Short-Term Price Analysis
As we can see on the 4-hours chart, XRP is looking bullish at the moment. Although the price is testing the lower boundary of the channel, we can expect the price to climb back shortly.
While anticipating a bounce, the critical resistance to keep in mind is 2786SAT and 2843SAT levels – above the grey falling trend line. If a rebound fails to occur, a breakout is a next thing to expect.
For such a move, 2600SAT and 2550SAT support levels may be exposed to selling pressure.
If these levels fail to hold, XRP may roll back to September 2019 low of 2400SAT level. As of now, the technical RSI and MACD are moving sideways, suggesting an indecisive market. However, it’s essential to wait for a break or bounce before initiating an entry.
Disclaimer: Information found on CryptoPotato is those of writers quoted. It does not represent the opinions of CryptoPotato on whether to buy, sell, or hold any investments. You are advised to conduct your own research before making any investment decisions. Use provided information at your own risk. See Disclaimer for more information.
Cryptocurrency charts by TradingView.
Technical analysis tools by Coinigy.
The post appeared first on CryptoPotato


