
- XRP surged by a total of 14.5% today to bring the price of the cryptocurrency above $0.30 as it reaches $0.33.
- The latest price increase has made XRP the strongest performing cryptocurrency from the top 20 ranked projects in the past 24 hours.
- Against Bitcoin, XRP broke above the pivotal 3000 SAT resistance to approach the 200-days EMA at 3250 SAT.
Key Support & Resistance Levels
XRP/USD
Support: $0.317, $0.31, $0.30.
Resistance: $0.337, $0.35, $0.361.
XRP/BTC:
Support: 2710 SAT, 2600 SAT, 2525 SAT.
Resistance: 3270 SAT, 3325 SAT, 3375 SAT.
XRP/USD: Ripple Breaks Upper Boundary Of Price Channel
Since our last analysis, XRP found strong support at $0.26 (200-days EMA) and rebounded higher toward $0.30. In today’s trading session, it increased further above $0.30 to break above the upper boundary of the previous ascending price channel.
XRP continued above the channel to reach the current resistance level at $0.337 before falling back toward $0.33.
The bullish run continues for XRP as it creates a fresh 3-month high, not seen since October 2019. It would need to drop beneath the 100-days EMA before this trend would be invalidated.
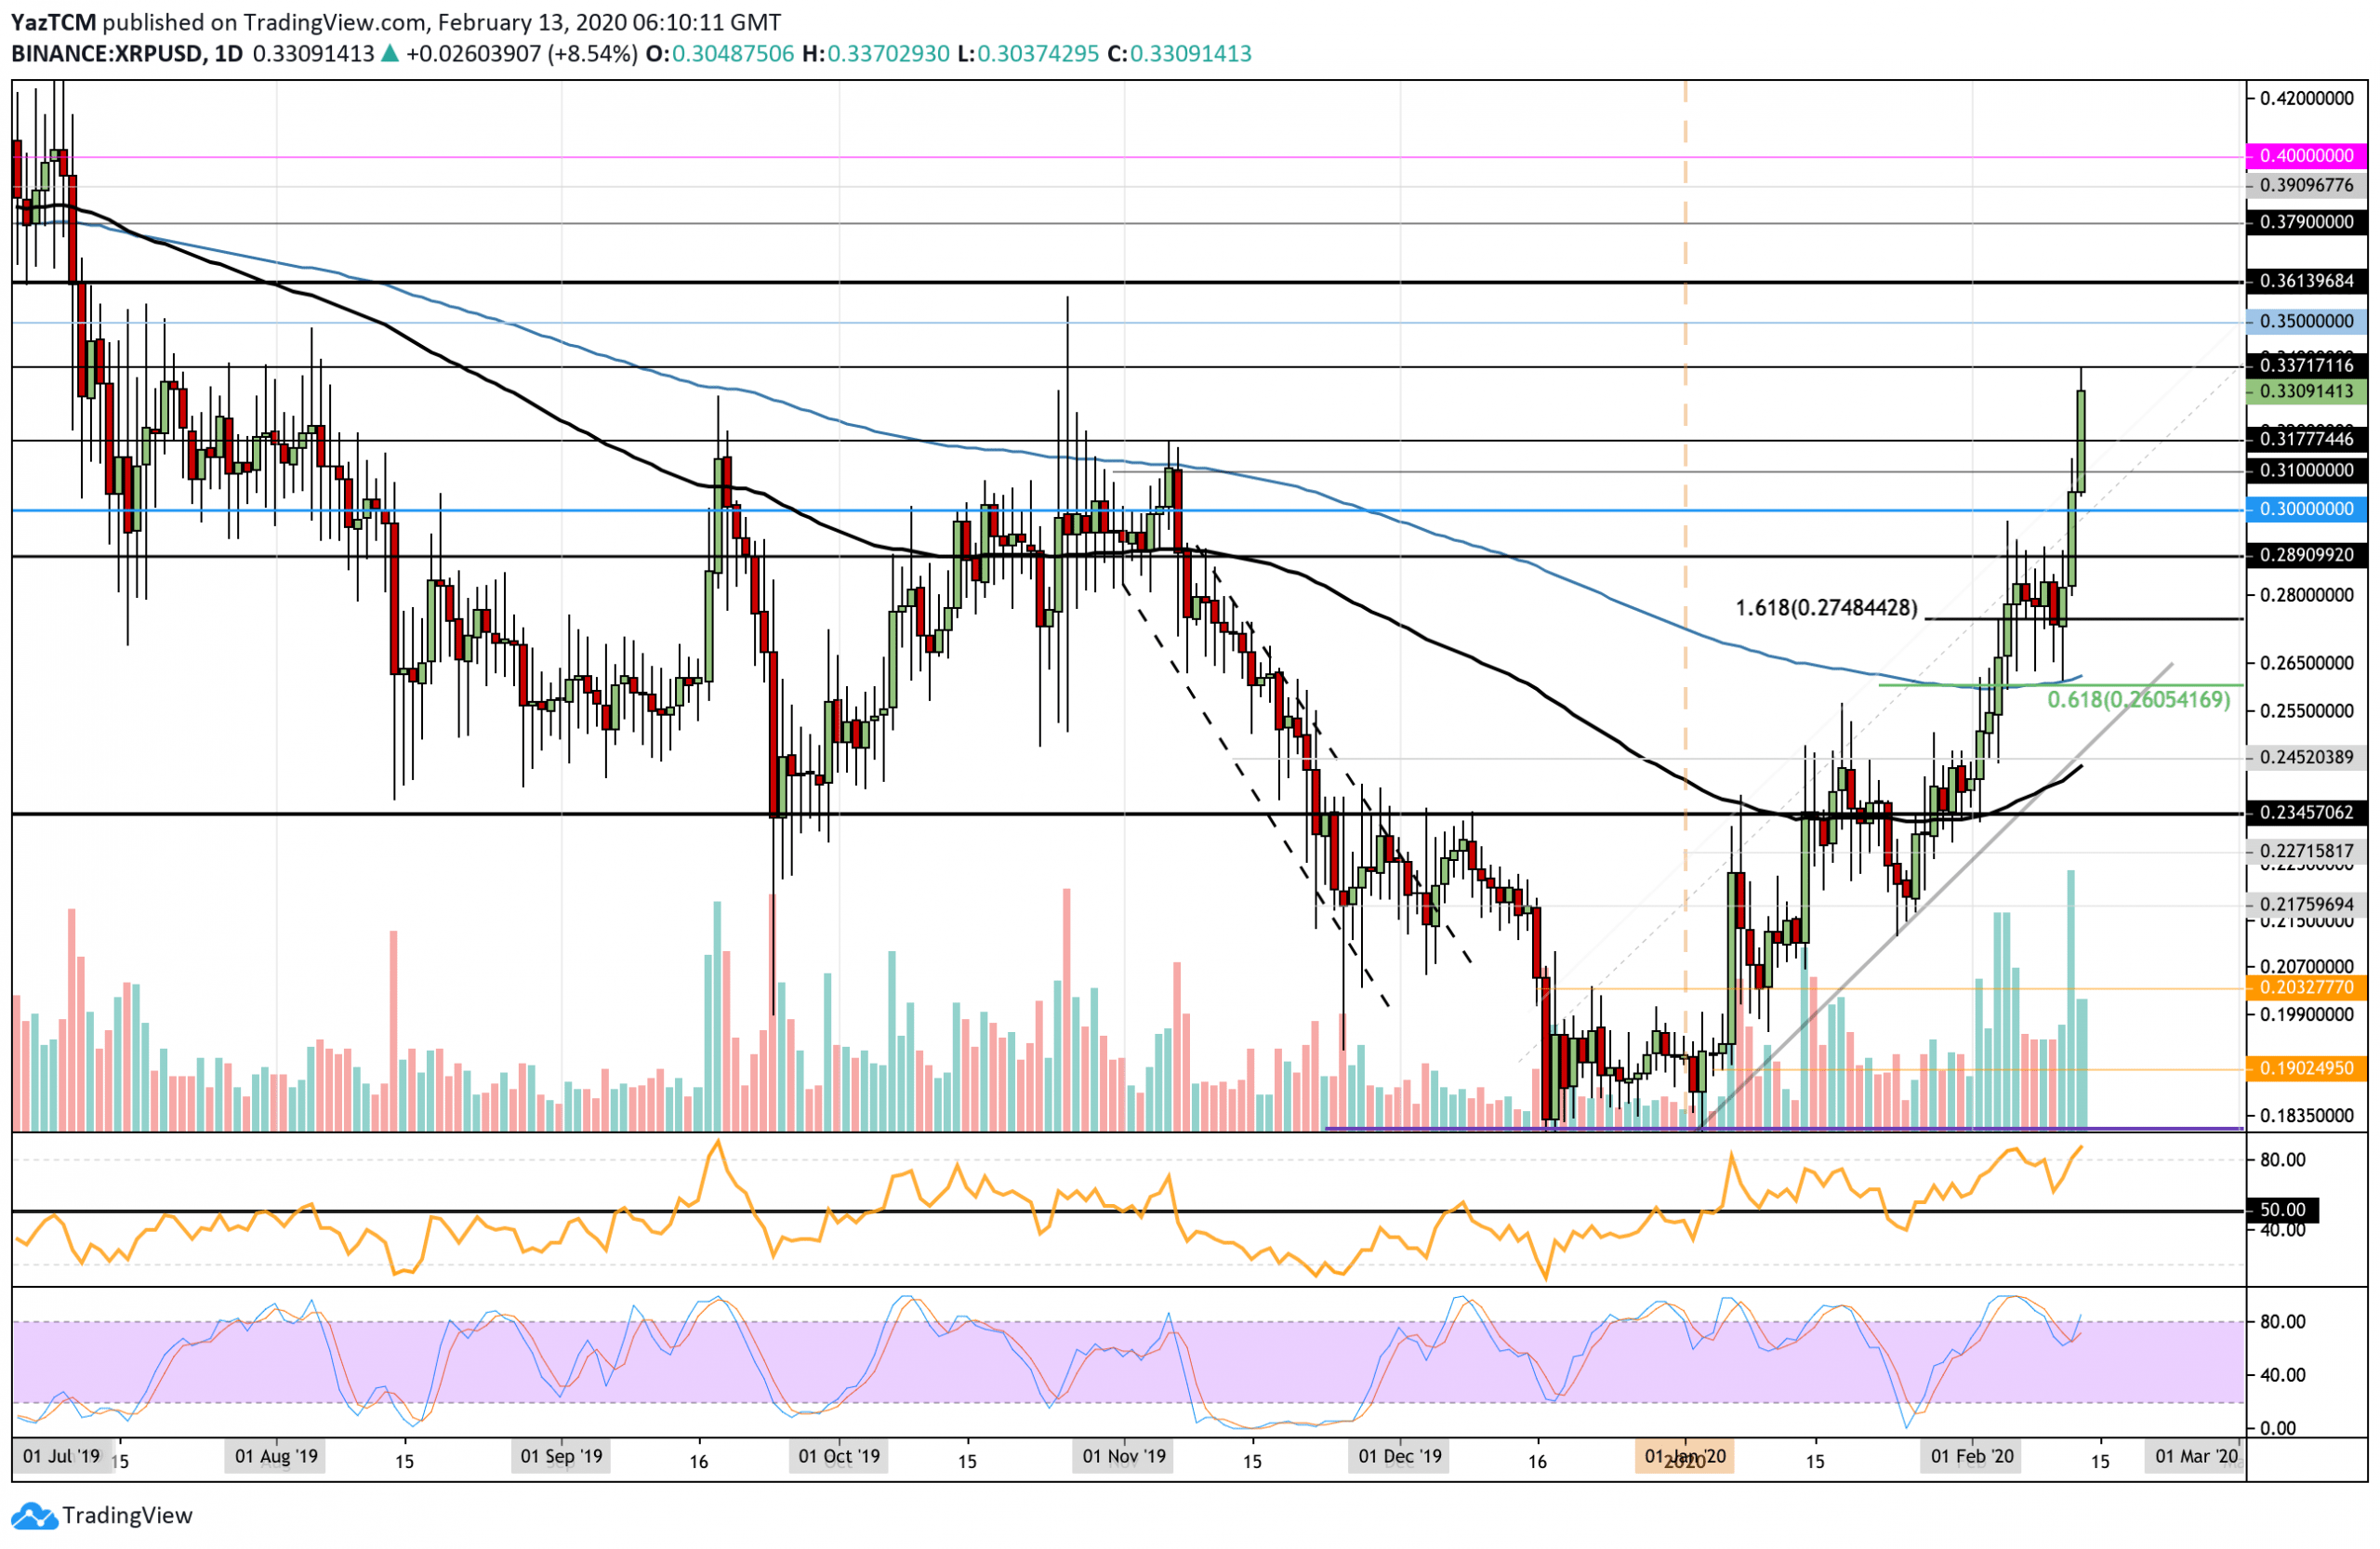
XRP/USD. Source: TradingView
XRP Short Term Price Prediction
If the bulls continue to penetrate above $0.337, the next level of resistance lies at $0.35. Above this, additional resistance lies at $0.361, $0.379, and $0.39.
On the other hand, if the sellers push lower, the first level of support lies at $0.317. Beneath this, additional support lies at $0.31, $0.30, and $0.289.
The RSI has returned to overbought conditions after taking a brief dip below it. Similarly, the Stochastic RSI also produced a bullish crossover signal with further room to move higher. This shows that the bulls remain in complete control over the market momentum.
XRP/BTC: XRP Breaches Pivitol 3000 SAT Level
Against Bitcoin, XRP firstly dropped into the support at 2710 SAT before rebounding higher. On the rebound, it penetrated above 2900 SAT, 3000 SAT, and 3115 SAT to reach as high as 3220 SAT, just beneath the 200-days EMA.
The break above 3000 SAT has started to turn XRP bullish. A further break above the 200-days EMA would confirm this. It would need to drop beneath 2700 SAT before the market would turn bearish.
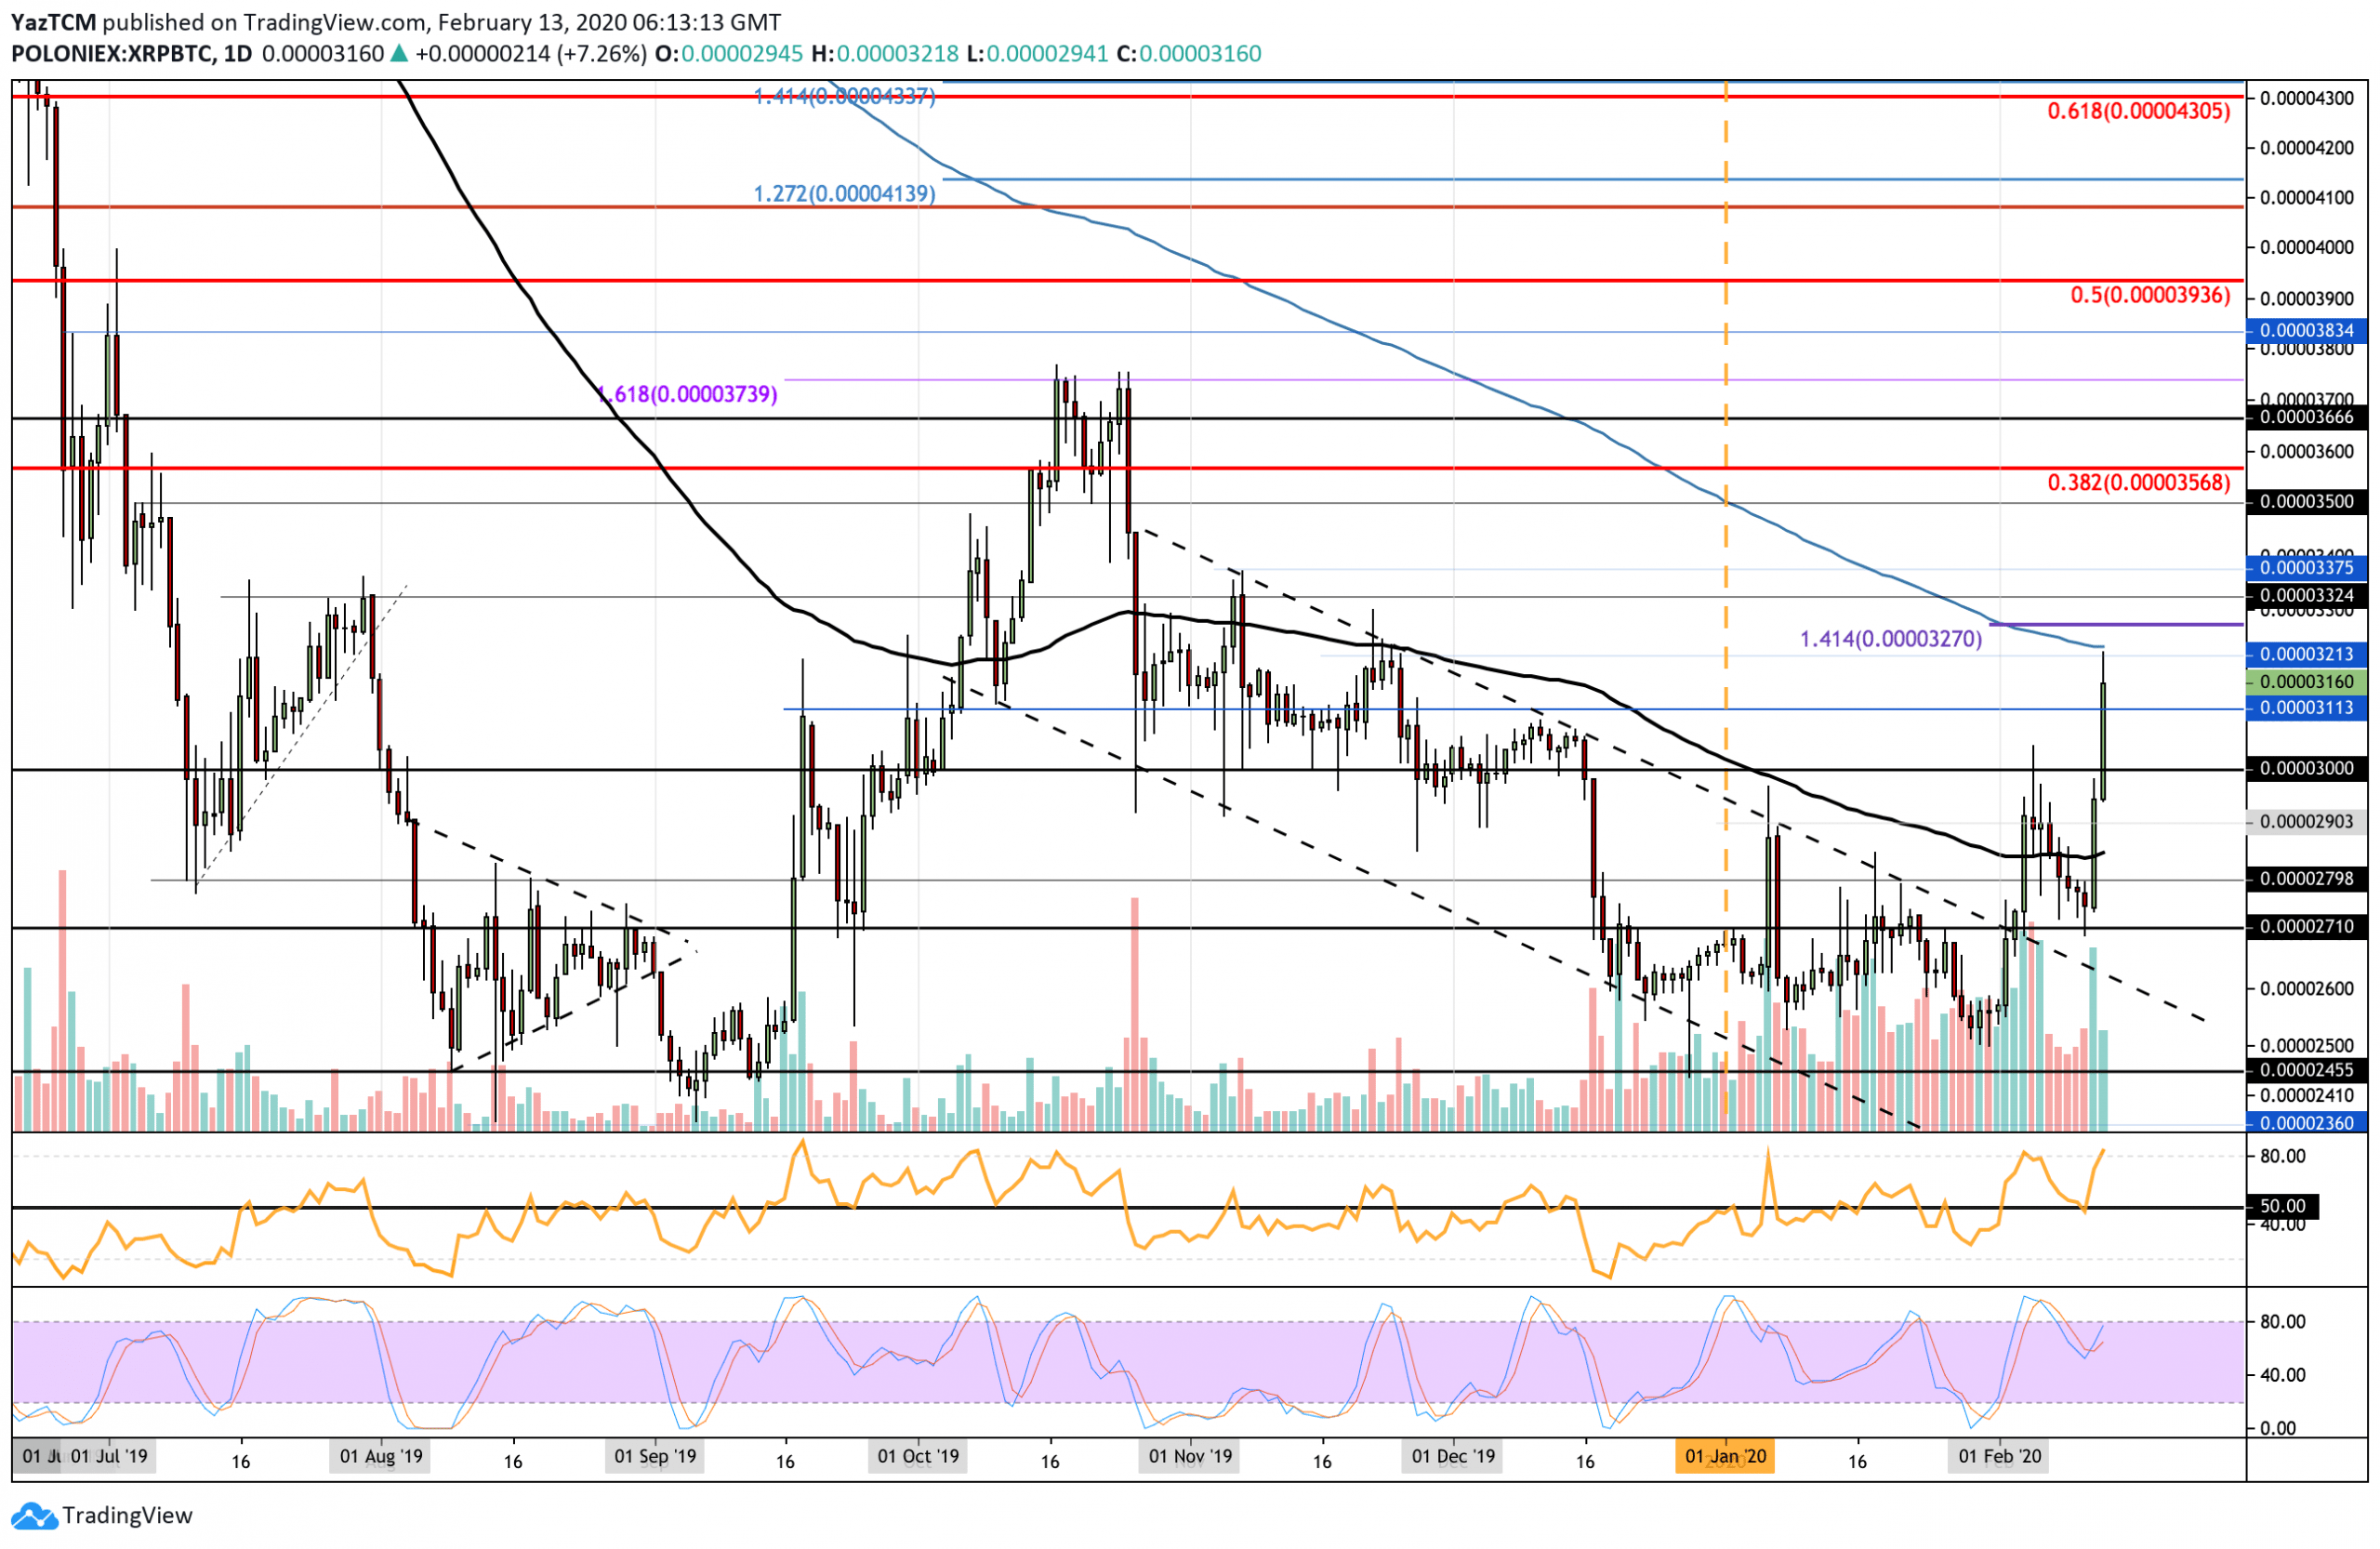
XRP/BTC. Source: TradingView
XRP Short Term Price Prediction
If the bulls can pass 3220 SAT (200-days EMA), close resistance lies at 3270 SAT. Above this, 3325 SAT, 2275 SAT, and 3500 SAT will provide additional resistance.
Toward the downside, 3115 SAT, and 3000 SAT should provide strong support. Beneath this, additional support lies at 2900 SAT and 2850 SAT (100-days EMA).
Similarly, the momentum indicators show the bulls are in control over the market momentum. The RSI has bounced from the 50 level to indicate the increase in the bullish momentum. Additionally, the Stochastic RSI produced a bullish crossover signal as it starts to move higher.
Disclaimer: Information found on CryptoPotato is those of writers quoted. It does not represent the opinions of CryptoPotato on whether to buy, sell, or hold any investments. You are advised to conduct your own research before making any investment decisions. Use provided information at your own risk. See Disclaimer for more information.
The post appeared first on CryptoPotato


