
- XRP continues to trade sideways between $0.1815 and $0.20
- Against BTC, it is starting to show signs of stabilization at 2600 SAT.
- The cryptocurrency is showing signs that it could surge if we see a bullish crossover on the Stochastic RSI indicator, against BTC.
Key Support & Resistance Levels
Support: $0.181, $0.17, $0.167.
Resistance: $0.19, $0.20, $0.212.
Support: 2600 SAT, 2530 SAT, 2455 SAT.
Resistance: 2750 SAT, 2900 SAT, 3000 SAT.
XRP/USD: Remains Trapped Within Tight Range
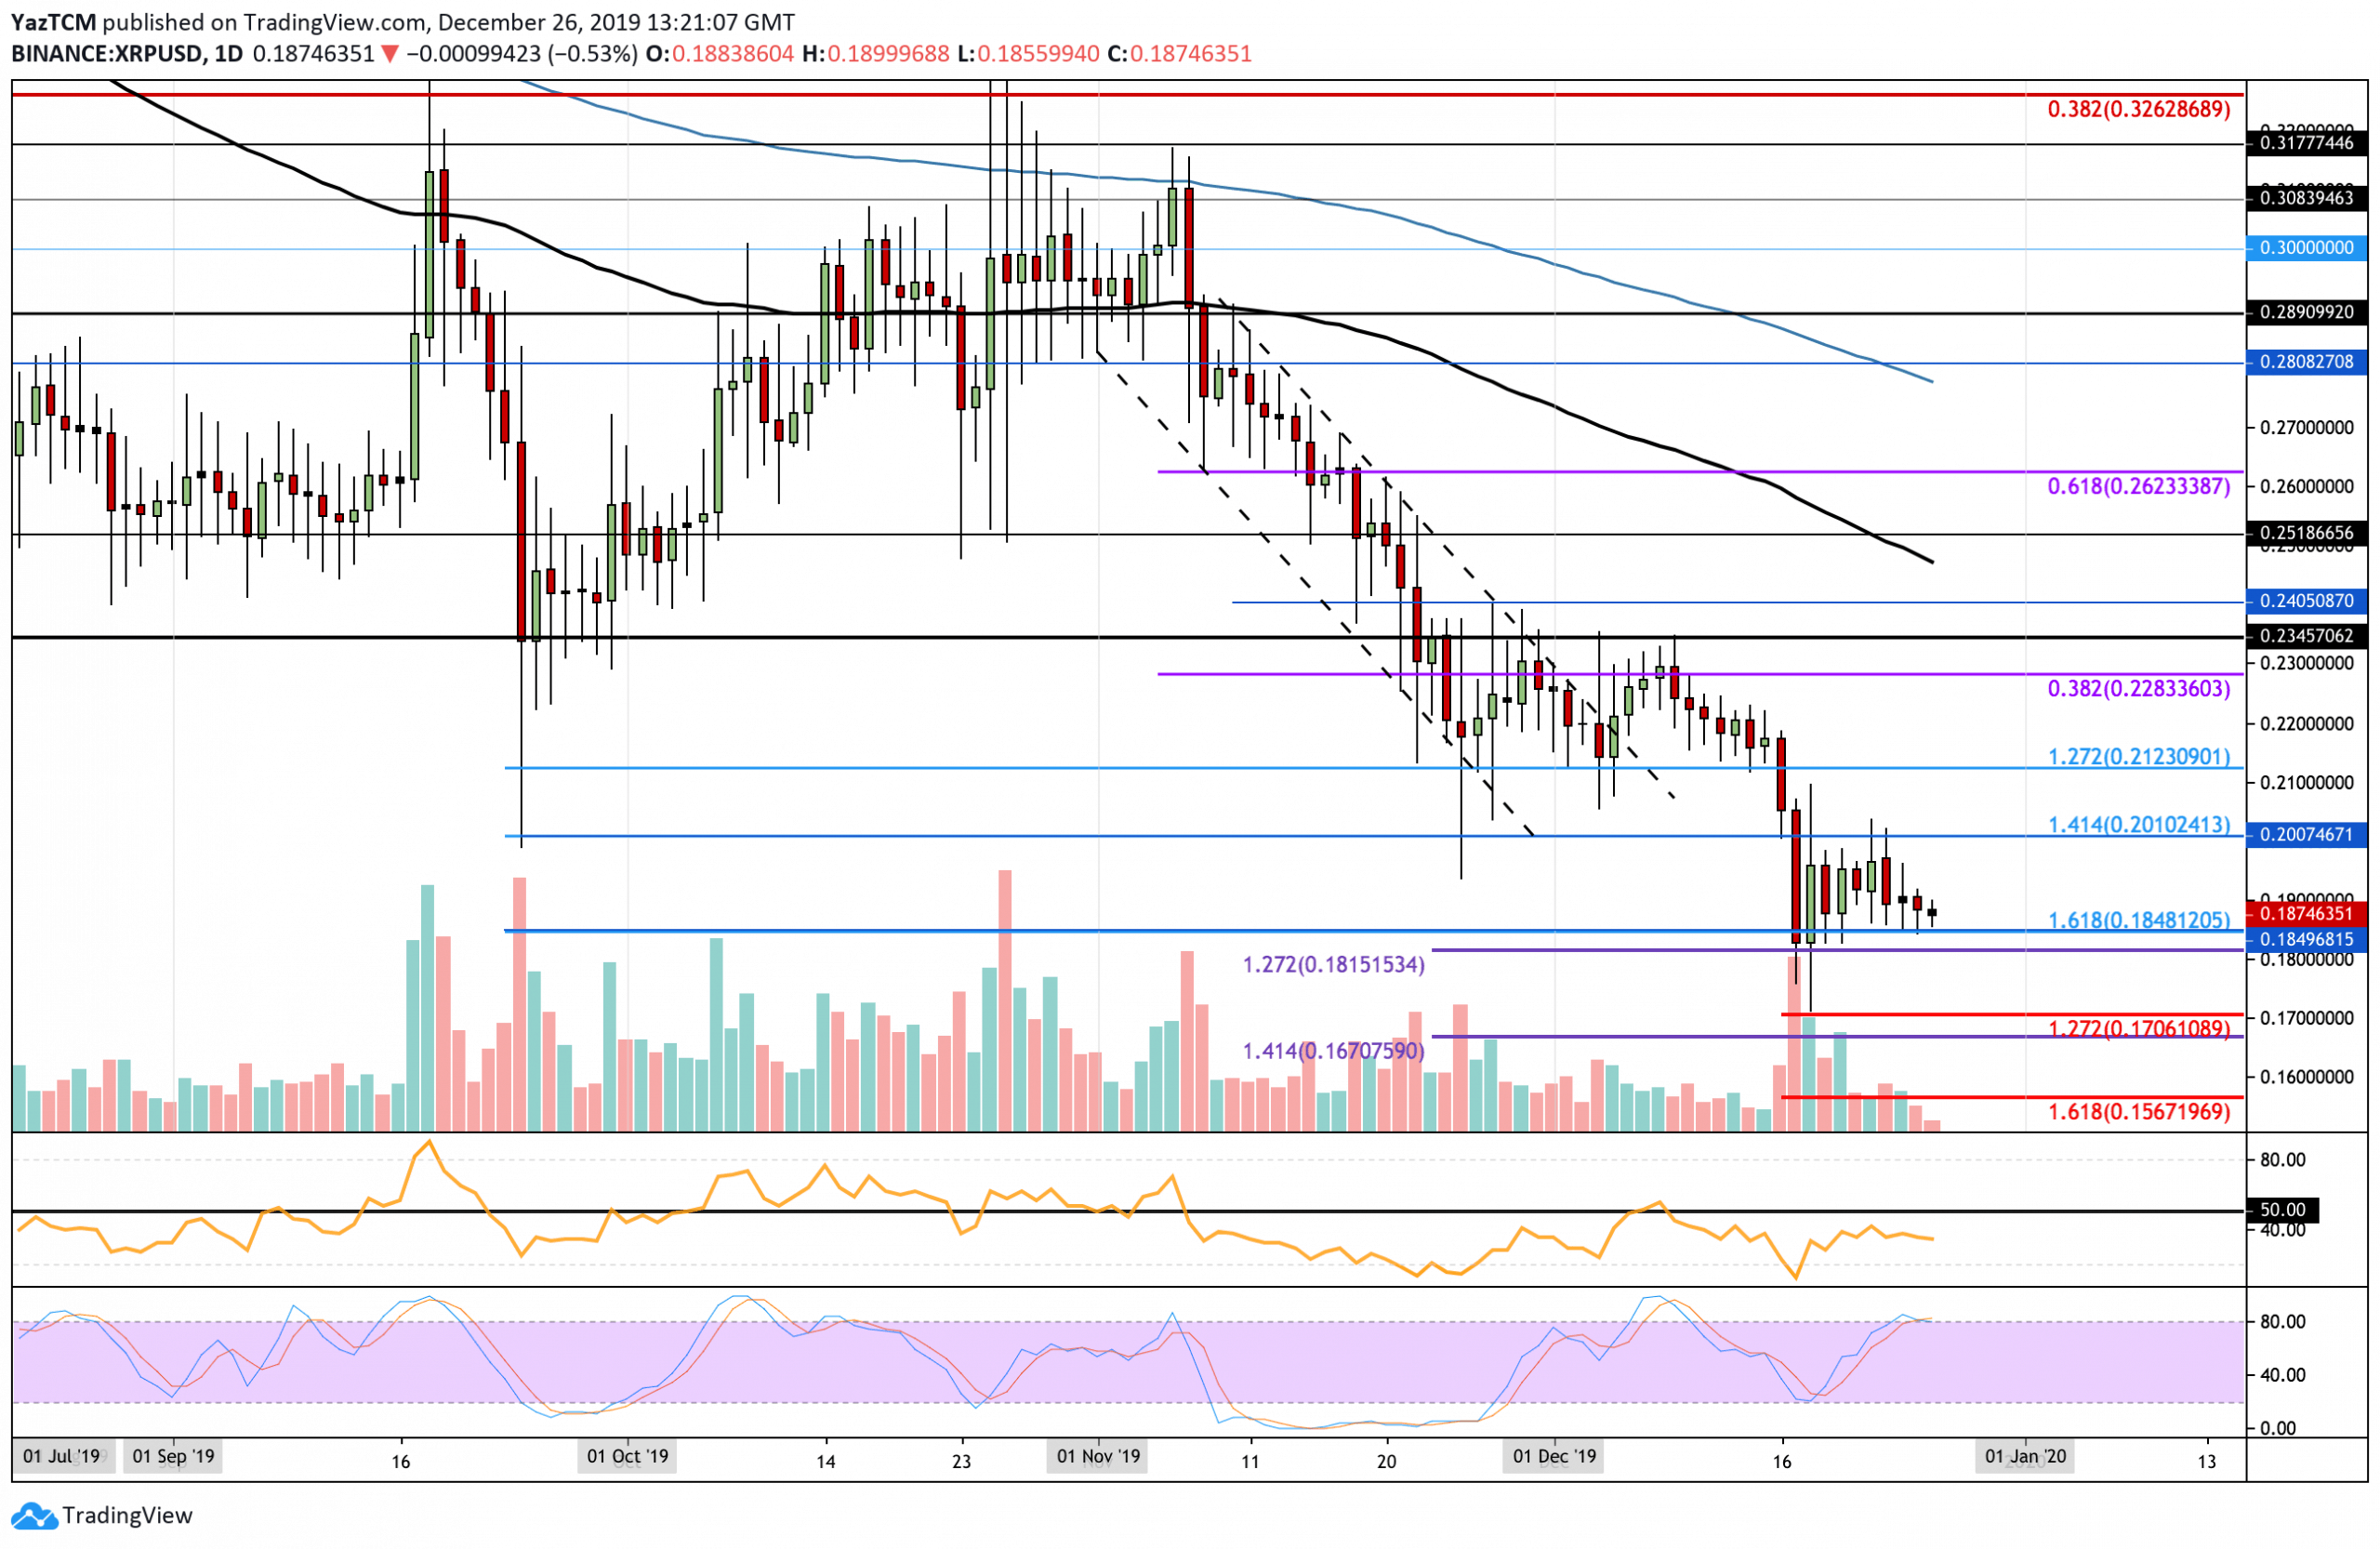
The daily chart shows the clear sideways movement that XRP has experienced over the past two weeks of trading. It is unable to break above the resistance at $0.20 but continues to be supported at the $0.1815 support, provided by a downside 1.272 Fib Extension.
A break above this range will dictate the next direction which the market would head toward. A break beneath the support at $0.1815 would send XRP into a bearish spiral as 2020 starts to trade. Alternatively, a break above $0.20 might see XRP heading back toward $0.25 as January begins.
XRP Short Term Price Prediction
If the sellers push the market back beneath $0.1850, the support at the $0.1815 level should continue to hold. Beneath $0.18, additional support is located at $0.17, $0.167, and $0.16. On the other hand, if the buyers regroup and push higher, initial strong resistance is found at $0.20. Above this, higher resistance lies at $0.212, $0.228, and $0.24.
The RSI has risen from oversold conditions, which shows that the selling pressure is starting to fade. However, the Stochastic RSI is lined up for a bearish crossover signal, which would send the market lower.
XRP/BTC – XRP Starting To Stabilize Around 2600 SAT
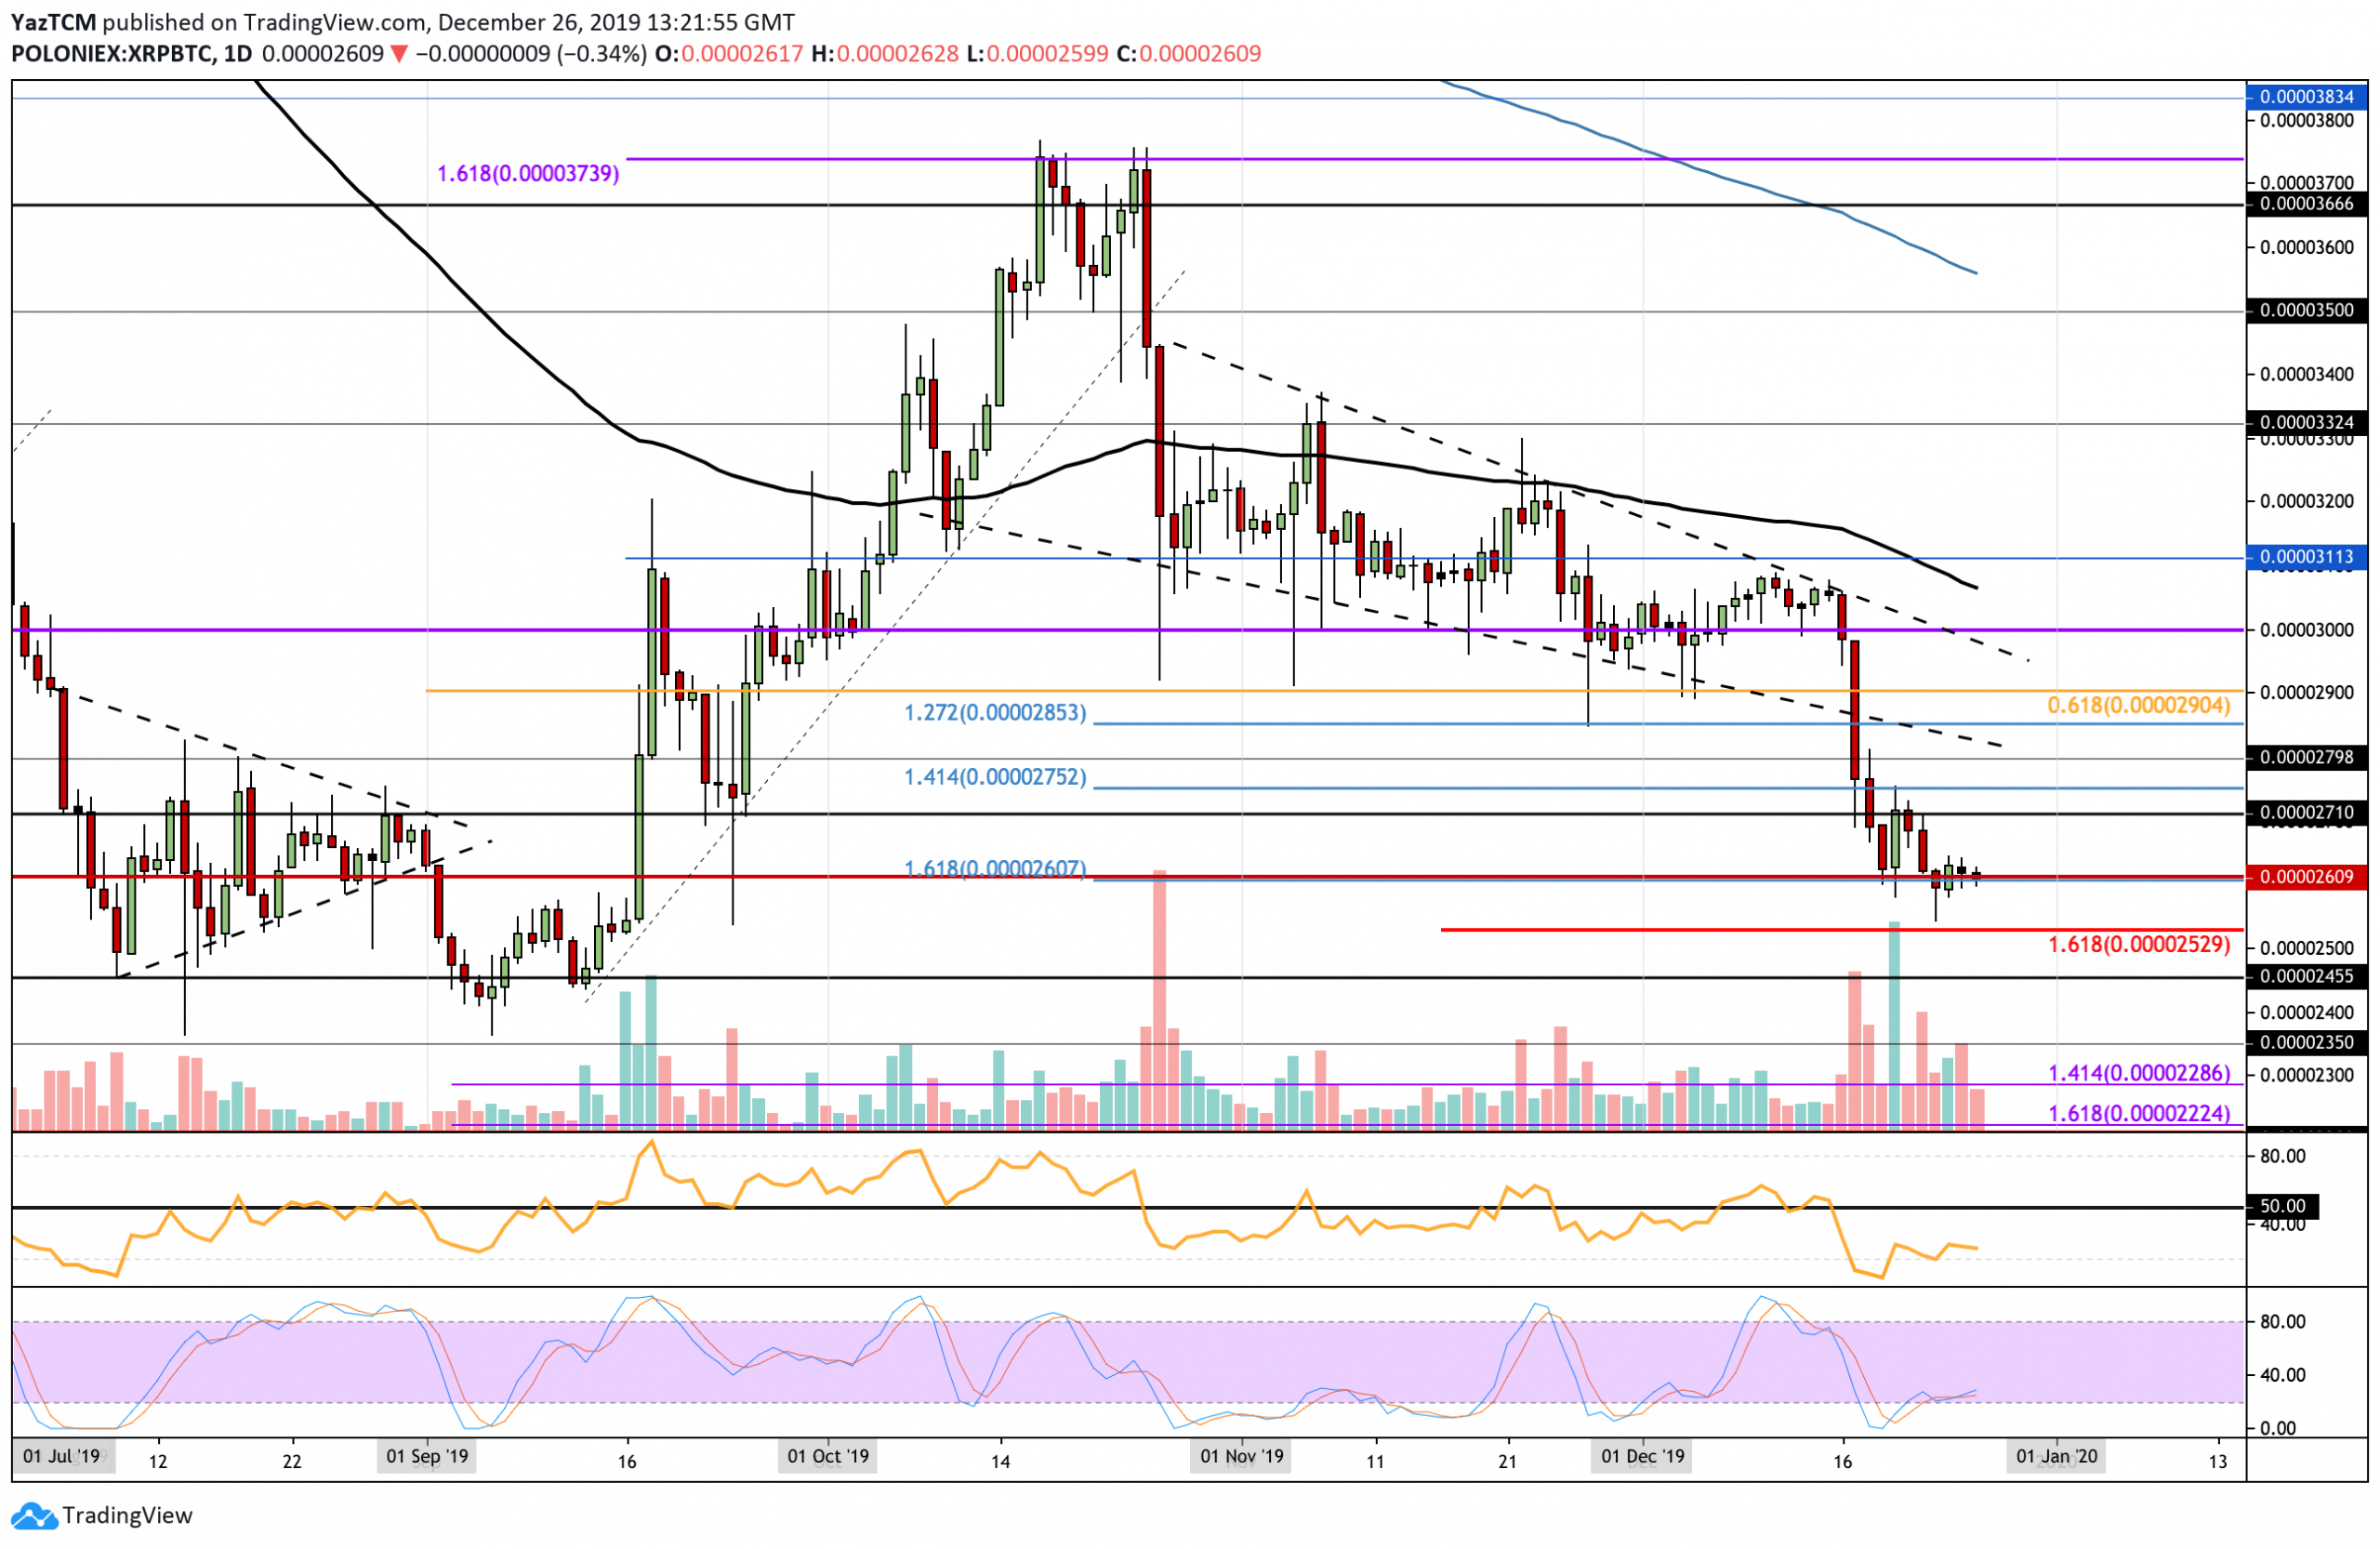
Against BTC, XRP has started to show signs that it is beginning to stabilize at the 2600 SAT support level. The cryptocurrency has been trading directly with this level of support over the past few days as the bulls continue to defend 2600 SAT.
For the bearish trend to continue, XRP must create fresh lows beneath 2600 SAT. For a bullish recovery, XRP must rise and break higher above the 3000 SAT resistance level.
XRP Short Term Price Prediction
If the sellers push XRP beneath the 2600 SAT level, initial support is found at 2530 SAT, which is provided by the downside 1.618 Fibonacci Extension level. Beneath this, additional support is located at 2455 SAT and 2350 SAT. Alternatively, if the bulls regroup and push higher, an initial resistance is found at 2710 SAT, 2752 SAT, and 2900 SAT. Above this, higher resistance lies at 300 SAT and 3100 SAT.
The Stochastic RSI is primed for a bullish crossover signal, which would send the market higher if delivered.
Disclaimer: Information found on CryptoPotato is those of writers quoted. It does not represent the opinions of CryptoPotato on whether to buy, sell, or hold any investments. You are advised to conduct your own research before making any investment decisions. Use provided information at your own risk. See Disclaimer for more information.
Cryptocurrency charts by TradingView.
Technical analysis tools by Coinigy.
You might also like:
The post appeared first on CryptoPotato


