
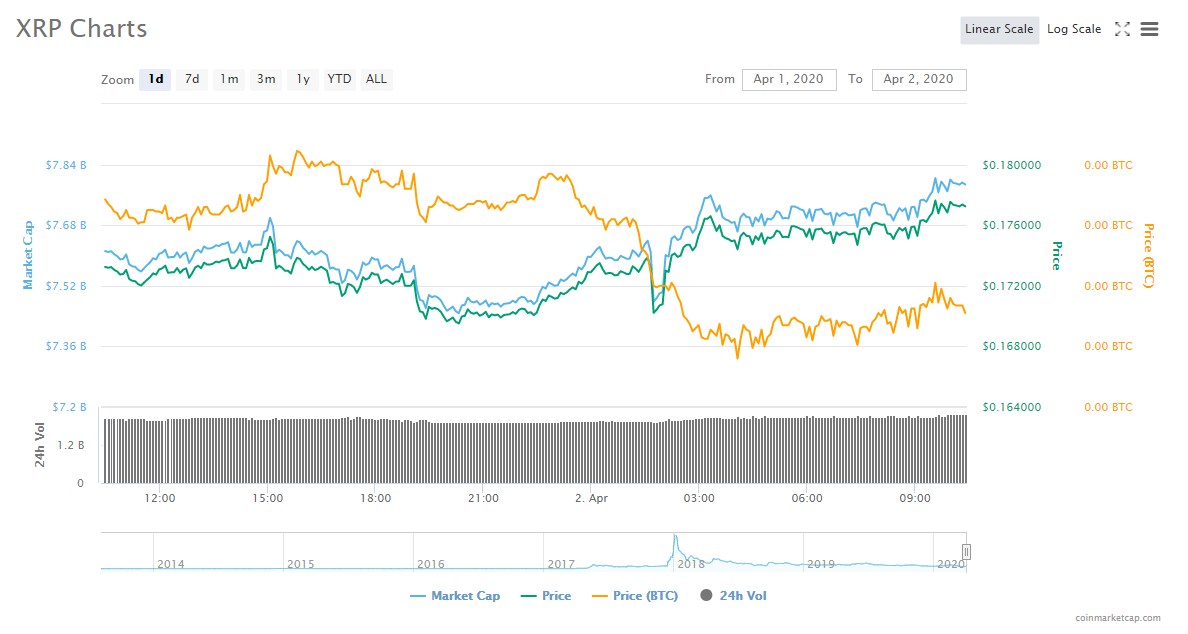
Ripple easily surpassed the $0.175 price barrier but couldn’t go beyond the $0.1774 resistance area. The cryptocurrency oscillated between major supports and resistance areas allowing price consolidation to take significant anchoring the cryptocurrency down at $0.1774 as of the time of preparing this text.
According to the Coindesk index, ripple currently trades at $0.177237 after increasing with 1% within the last 24 hours. The cryptocurrency recently broke a major resistance which delayed it below $0.1750 and kept showing up although in micro dollar units. Unfortunately, Ripple’s Bulls seem to fail to fight off the Bears at around $0.1774 keeping price oscillating with an upper limit set at $0.1774. Current market trends favor the Bears with RSI indicators slowing the price shift towards the overbought zone.
Ripple price Facing at Major Decision Point
Ripple price data for the past 24 hours shows that the cryptocurrency faces a major confluence level. The trends show that sideways trading could easily become dominant in the market. Ripple prices kept oscillating between bundles of resistance and support zones with a smaller chance of gaining significance in the support zones unless the technical indicators change trends.
On the upper side of the market, the first hiccups to the bullish trends are around $0.1785. Several technical indicators including the previous high one-day, the Bollinger Band 1-hour upper curve and the Fibonacci 23.6% one-week all reside around this zone. Once Ripple breaks through this resistance zone, the price could rally beyond $0.18.
However for the Bullist trends to continue rallying another major resistance at $0.1877 shown by the pivot point daily resistance three, SMA 200 4-hour and the previous week high must be overcome. Similarly, before the cryptocurrency’s price could reach the $0.20 price levels it has to break major resistance at $0.1969.
Meanwhile, the disadvantage Bulls are facing is that support and resistance measures have equal magnitude indicated that more support is required to break a resistance level. The first support target lies around $0.1749. This is visible from the converging SMA 45-minutes, Fibo 23.6% one-day and Bollinger Band 1 hour middle curve. However, if bears continue to take the market, buyers crowded around $0.1731 will have to be robust to control losses. This area shows the SMA 100 1-hour and Bollinger Band 4-hour middle. Other major levels traders should closely observe are $0.1694,$0.1657 and $0.1602.
The post Ripple Price Analysis: XRP/USD Fails to Break Resistance at $0.1774 appeared first on Cryptocurrency information | Cryptocurrency News | Bitcoin News and Crypto Guide.
The post appeared first on Coinpedia


