
Ripple price started a fresh decrease after it failed to break the $0.2920 resistance against the US dollar.Bitcoin price is struggling to hold the main $10,500 support area.This week’s followed bullish trend line with support near $0.2740 was breached on the hourly chart of the XRP/USD pair (data source from Kraken).The pair is currently trading below the key $0.2700 support and it might accelerate its decline.Ripple price is showing bearish signs below key supports against the US Dollar and bitcoin. XRP is currently at a risk of more downsides below the $0.2600 support.Ripple Price AnalysisRecently, XRP price climbed above the $0.2800 and $0.2850 resistance levels against the US Dollar. However, the XRP/USD pair struggled to break the $0.2900 and $0.2920 resistance levels. A swing high was formed near $0.2918 and the price started a fresh decline. There was a break below the $0.2800 support and the 100 hourly simple moving average. Moreover, bitcoin and Ethereum are also struggling to hold key supports.Ripple price is currently under pressure and it recently broke the $0.2750 support. Moreover, this week’s followed bullish trend line with support near $0.2740 was breached on the hourly chart of the XRP/USD pair. The pair declined below the 50% Fib retracement level of the upward move from the $0.2484 low to $0.2918 high. It has opened the doors for more losses below $0.2700.An immediate support is near the $0.2650 level. It represents the 61.8% Fib retracement level of the upward move from the $0.2484 low to $0.2918 high. If there are more downsides, the price could decline towards the $0.2600 support. Any further losses is likely to lead the price towards the next important support area near the $0.2500 level.On the upside, the previous support near the $0.2700 level is likely to act as a resistance. Additionally, the 100 hourly simple moving average is near the $0.2750 level to prevent an upward move. Therefore, to start a fresh increase, the price must climb back above $0.2750 and the 100 hourly SMA.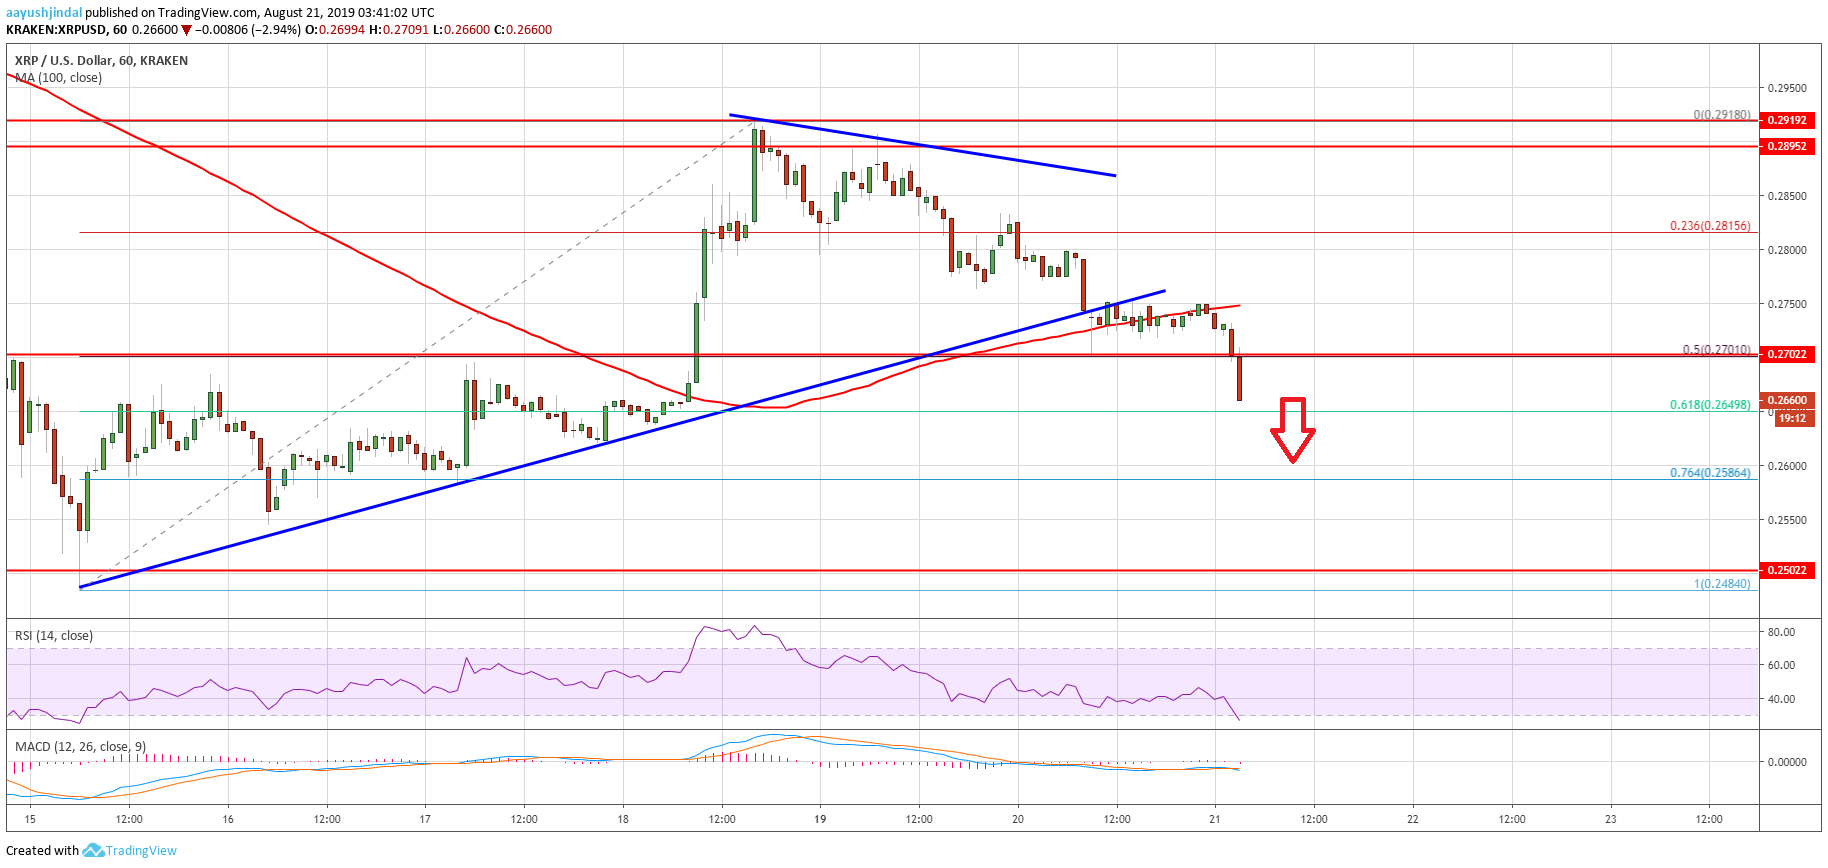 Looking at the chart, ripple price is facing an increase in selling pressure below the 100 hourly SMA and the $0.2700 support. If the bulls fail to protect the $0.2650 support, the price is likely to accelerate its decline. The next major support is near the $0.2500 level, below which the bears might target a fresh monthly low.Technical IndicatorsHourly MACD – The MACD for XRP/USD is currently gaining strength in the bearish zone.Hourly RSI (Relative Strength Index) – The RSI for XRP/USD is currently declining heavily below the 40 level.Major Support Levels – $0.2650, $0.2600 and $0.2500.Major Resistance Levels – $0.2700, $0.2750 and $0.2850.The post appeared first on NewsBTC


