
Ripple price started an upside correction after trading as low as $0.2580 against the US dollar.Bitcoin price is back above $10,000, but it is facing many important resistances near $10,250.Yesterday’s followed key declining channel with resistance near $0.2670 was breached on the hourly chart of the XRP/USD pair (data source from Kraken).The pair is now facing a strong resistance near the $0.2750 level and the 100 hourly SMA.Ripple price is trading near a major resistance at $0.2750 against the US Dollar, similar to bitcoin. Therefore, XRP remains at a risk of more downsides below $0.2620 in the near term.Ripple Price AnalysisYesterday, we saw a major decline in XRP price below the $0.2800 and $0.2700 support levels against the US Dollar. Moreover, the price settled below $0.2700 and the 100 hourly simple moving average. Finally, the price broke the $0.2620 support and traded as low as $0.2581. Recently, ripple started an upside correction and traded above the $0.2620 and $0.2650 resistance levels.Additionally, the price climbed above the 23.6% Fib retracement level of the last key decline from the $0.2919 high to $0.2581 low. More importantly, yesterday’s followed key declining channel with resistance near $0.2670 was breached on the hourly chart of the XRP/USD pair. The pair climbed above the $0.2700 level, but it faced a strong resistance near the $0.2750 level.The 50% Fib retracement level of the last key decline from the $0.2919 high to $0.2581 low acted as a major resistance. Moreover, it seems like the 100 hourly simple moving average is preventing an upside break above $0.2750. If there is a successful close above $0.2750 and the 100 hourly SMA, the price could continue to rise in the coming sessions.Conversely, if the bulls continue to struggle near $0.2750, the price might start a fresh decline. An immediate support is near the $0.2650 level. A downside break below the $0.2650 level might set the pace for more losses towards the $0.2600 and $0.2580 levels. Any further downsides could push the price towards the $0.2500 support level in the near term.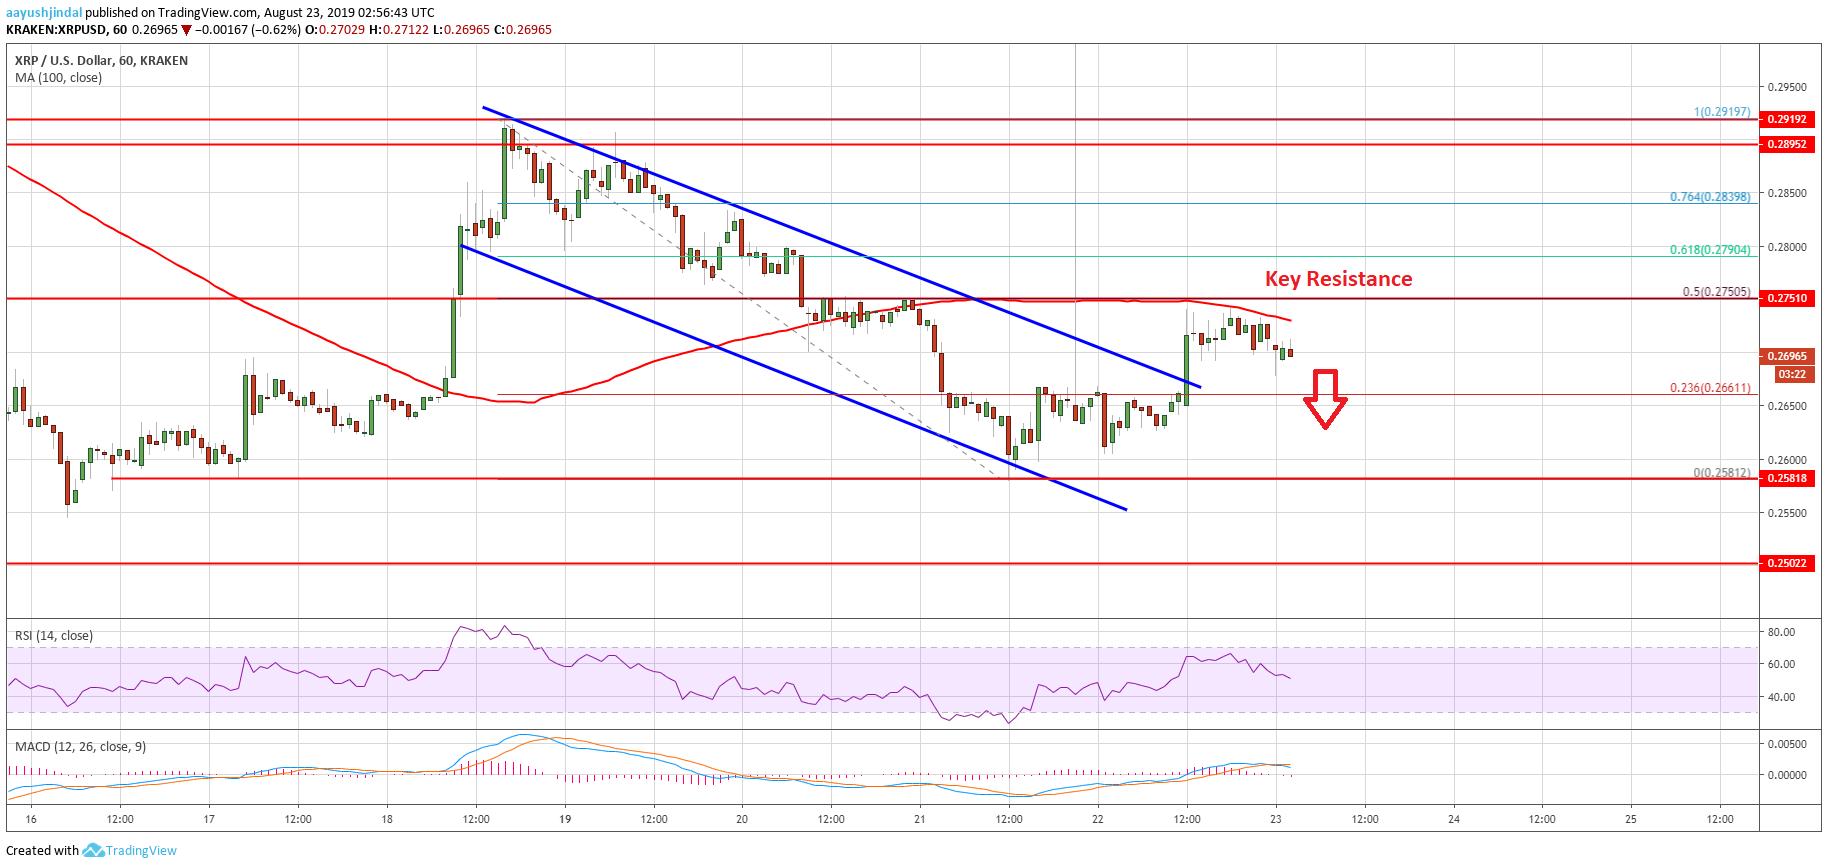 Looking at the chart, ripple price is clearly facing a strong resistance near the 100 hourly simple moving average and the $0.2750 level. Therefore, the bears may perhaps aim a fresh decline below the $0.2650 and $0.2600 levels. Only a successful close above $0.2750 might help the bulls in gaining strength.Technical IndicatorsHourly MACD – The MACD for XRP/USD is slowly gaining pace in the bearish zone.Hourly RSI (Relative Strength Index) – The RSI for XRP/USD is currently declining towards the 50 level.Major Support Levels – $0.2650, $0.2600 and $0.2580.Major Resistance Levels – $0.2750, $0.2840 and $0.2900.The post appeared first on NewsBTC


