
Ripple price failed to break the main $0.2650 resistance area against the US dollar.The price is currently correcting lower and is trading near the key $0.2580 support area.There was a break below a major bullish trend line with support at $0.2620 on the hourly chart of the XRP/USD pair (data source from Kraken).The price could either decline further towards $0.2500 or it might bounce back towards $0.2650.Ripple price is struggling to continue higher against the US Dollar, while bitcoin is holding gains. XRP price remains at a risk of a fresh decline towards the $0.2500 support.Ripple Price AnalysisYesterday, XRP price made another attempt to surpass the $0.2650 resistance area against the US Dollar. However, the bulls failed to gain momentum, resulting in bearish moves below the $0.2620 support area. The price even traded below the $0.2600 support level and the 100 hourly simple moving average. On the other hand, bitcoin is still trading near the $10,500 support level, with positive moves.Recently, ripple price broke the 50% Fib retracement level of the last major move from the $0.2509 low to $0.2673 high. Moreover, there was a break below a major bullish trend line with support at $0.2620 on the hourly chart of the XRP/USD pair. The pair is now trading near the $0.2580 support area. Additionally, the 61.8% Fib retracement level of the last major move from the $0.2509 low to $0.2673 high is near the $0.2575 level.If the price continues to slide, it could test the $0.2540 support level. Any further declines might push the price back towards the main $0.2500 support level. On the upside, an immediate resistance is near the $0.2600 level and the 100 hourly simple moving average. Moreover, there is a connecting bearish trend line forming with resistance near the $0.2605 on the same chart.If there is a successful close above the $0.2600 and $0.2605 resistance levels, the price could climb above $0.2620. If there are more upsides, the price could retest the main $0.2650 resistance area in the near term.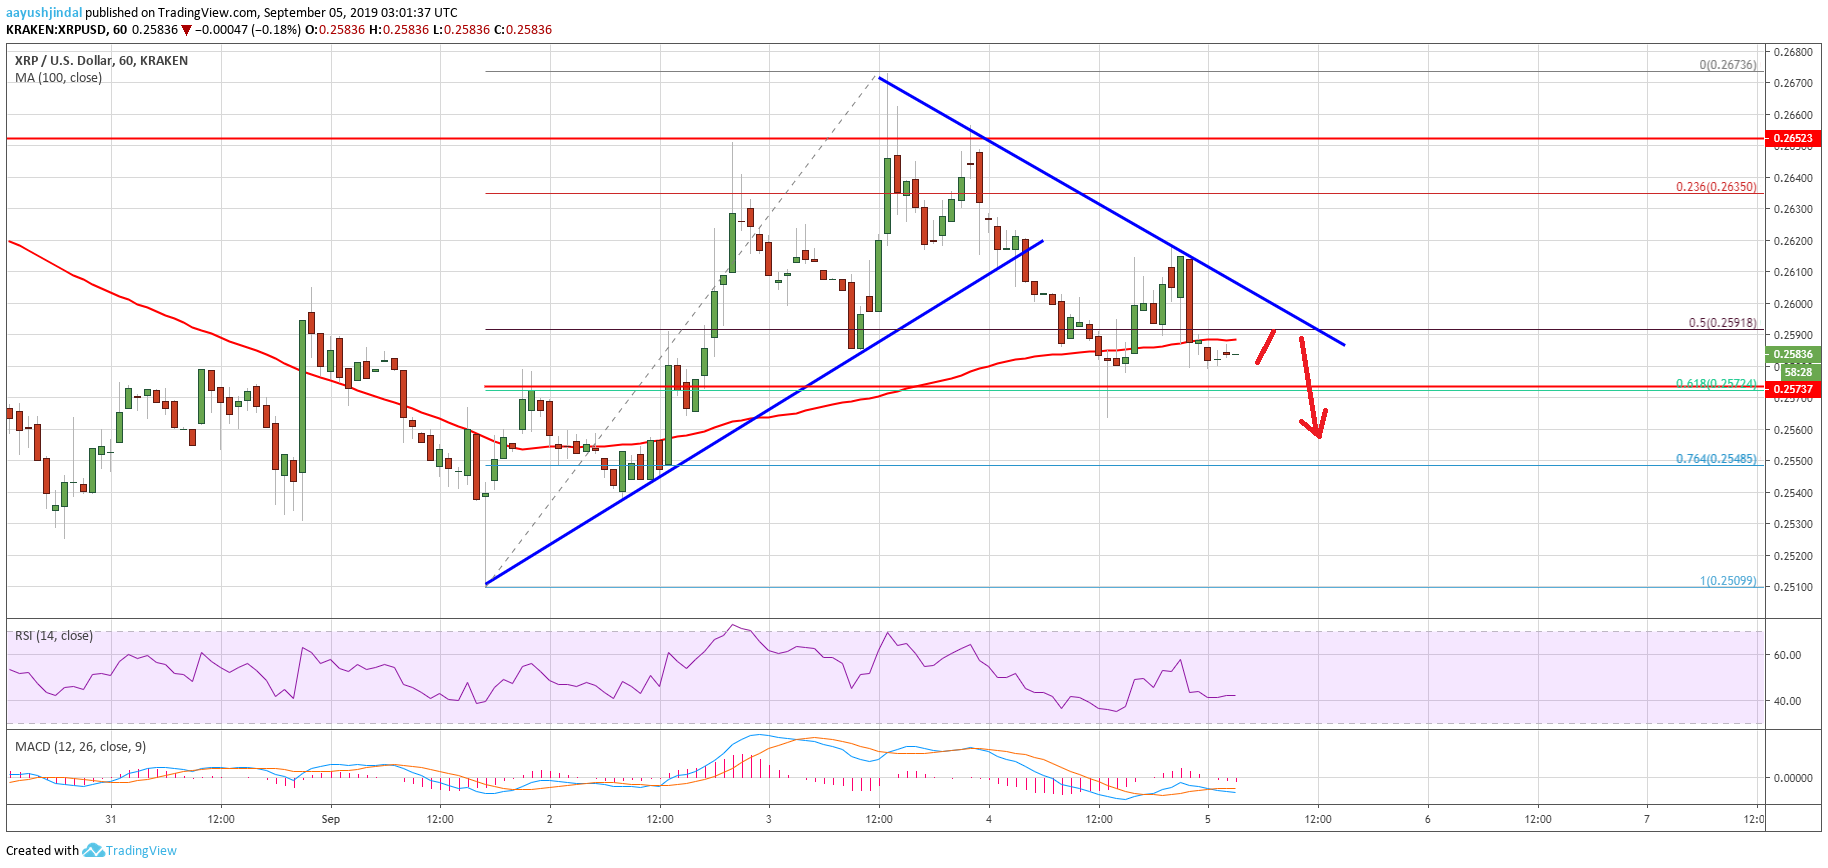 Looking at the chart, ripple price is clearly struggling to hold gains above the $0.2580 level. Therefore, there are high chances of more downsides below the $0.2550 level in the near term. On the upside, there are many hurdles for the bulls, including $0.2600, $0.2605 and $0.2620. The main hurdle remains near the $0.2650 level.Technical IndicatorsHourly MACD – The MACD for XRP/USD is currently placed in the bearish zone.Hourly RSI (Relative Strength Index) – The RSI for XRP/USD is now below the 50 level, with a few bearish signs.Major Support Levels – $0.2580, $0.2550 and $0.2500.Major Resistance Levels – $0.2600, $0.2620 and $0.2650.The post appeared first on NewsBTC


