
Ripple price is holding the $0.2650 support and is correcting higher against the US dollar.Bitcoin price rallied 5%, but it failed to continue above the $10,500 resistance area.There is a key major bullish trend line with support near $0.2680 on the hourly chart of the XRP/USD pair (data source from Kraken).The pair is likely to extend its recovery towards the key $0.2900 and $0.2920 resistance levels.Ripple price is showing signs of a decent recovery against the US Dollar, but struggling vs bitcoin. XRP price might climb higher above $0.2800, but $0.2900-0.2920 could cap upsides.Ripple Price AnalysisThis past week, XRP price extended its decline below the $0.2800 support against the US Dollar. Moreover, the price traded below $0.2620 and tested the $0.2580 support area. Later, there was a decent upward move above the $0.2650 and $0.2700 resistance levels. Moreover, the price climbed above the $0.2750 resistance plus the 100 hourly simple moving average, and traded towards the $0.2800 resistance.A swing high is formed near the $0.2806 and it is currently correcting gains. It traded below the $0.2780 level plus the 23.6% Fib retracement level of the recent wave from the $0.2658 low to $0.2806 high. On the downside, there are a few key supports near the $0.2740 and $0.2720 levels. The main support is near the $0.2715 and the 100 hourly simple moving average.Moreover, there is a key major bullish trend line with support near $0.2680 on the hourly chart of the XRP/USD pair. An immediate support is near the $0.2730 level. It represents the 50% Fib retracement level of the recent wave from the $0.2658 low to $0.2806 high. Therefore, ripple bulls might protect the $0.2700-0.2720 support area in the coming sessions.On the upside, an initial resistance is near the $0.2780 and $0.2800 levels. A successful close above the $0.2800 resistance could open the doors for a decent ride. The main resistances are near the $0.2900 ad $0.2920 levels (the ones acted as a strong barrier this past week). Conversely, if the price fails to stay above the $0.2700 support and the trend line, it could continue to decline in the coming sessions.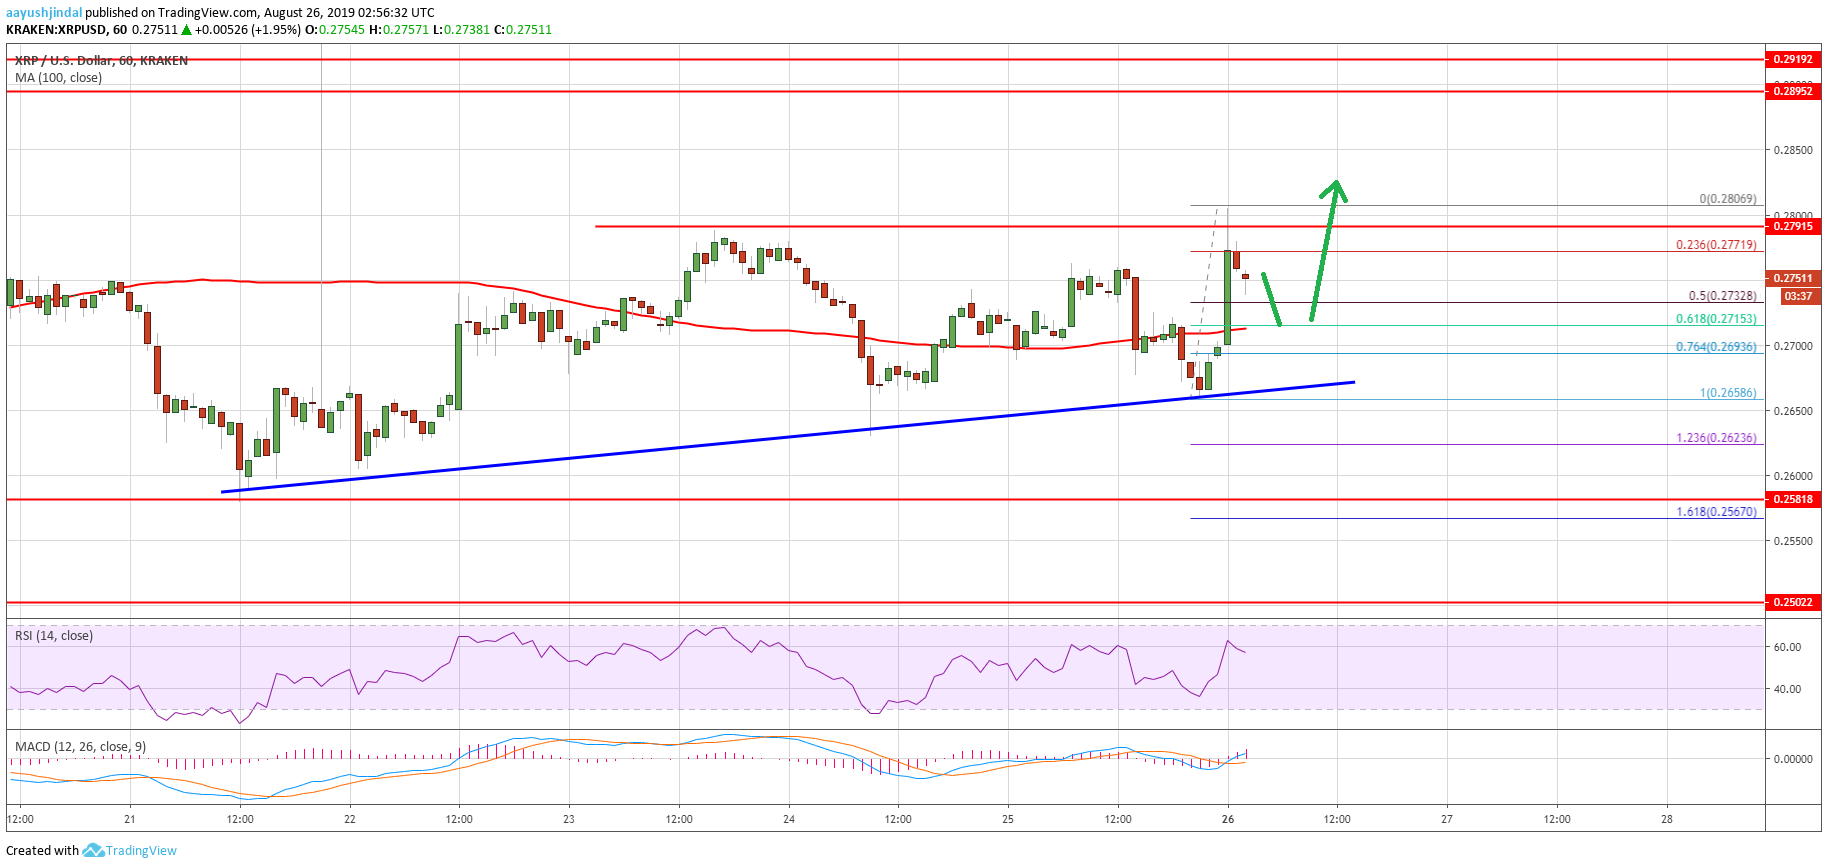 Looking at the chart, ripple price is showing a few positive signs above the $0.2700 support and pivot area. However, the price must gain momentum above the $0.2800 resistance to revisit the main $0.2900 resistance in the near term.Technical IndicatorsHourly MACD – The MACD for XRP/USD is currently placed nicely in the bullish zone.Hourly RSI (Relative Strength Index) – The RSI for XRP/USD is currently correcting lower towards the 50 level.Major Support Levels – $0.2720, $0.2700 and $0.2680.Major Resistance Levels – $0.2780, $0.2800 and $0.2900.The post appeared first on NewsBTC


