
Ripple price is currently trading with a positive bias above $0.2750 against the US dollar.Bitcoin price climbed above the $10,200 and $10,300 resistance levels to start a decent recovery.There is a key bullish trend line forming with support near $0.2700 on the hourly chart of the XRP/USD pair (data source from Kraken).The pair is likely to accelerate higher above the $0.2900 and $0.2950 resistance levels.Ripple price is currently rebounding with a positive bias against the US Dollar, similar to bitcoin. XRP price must surpass the $0.2920 resistance to continue higher.Ripple Price AnalysisThis past week, we saw a strong decline in XRP price below the $0.3000 support against the US Dollar. The XRP/USD pair even broke the $0.2500 support level. Finally, it traded towards the $0.2340 level and recently started an upside correction. The crypto market recovered in the past few sessions, with positive moves in Ethereum, ripple, EOS and litecoin.Ripple price climbed above the $0.2650 and $0.2700 resistance levels to move into a positive zone. Moreover, there was a break above the $0.2800 resistance and a close above the 100 hourly simple moving average. The upward move was positive, with a break above the $0.2850 resistance. However, the price ran into a crucial resistance area near the $0.2900 and $0.2920 levels.At the moment, the price is correcting gains and recently declined below the 23.6% Fib retracement level of the upward move from the $0.2616 low to $0.2913 high. However, there are many supports on the downside near the $0.2750 and $0.2700 levels. Additionally, there is a key bullish trend line forming with support near $0.2700 on the hourly chart of the XRP/USD pair.The 50% Fib retracement level of the upward move from the $0.2616 low to $0.2913 high is also near the $0.2760 level to act as a support. Therefore, if there is a downside correction, the bulls are likely to protect $0.2750 and $0.2700. On the upside, the main resistances are near $0.2900 and $0.2920. Therefore, a successful break above $0.2920 might accelerate gains towards the $0.3000 and $0.3050 levels.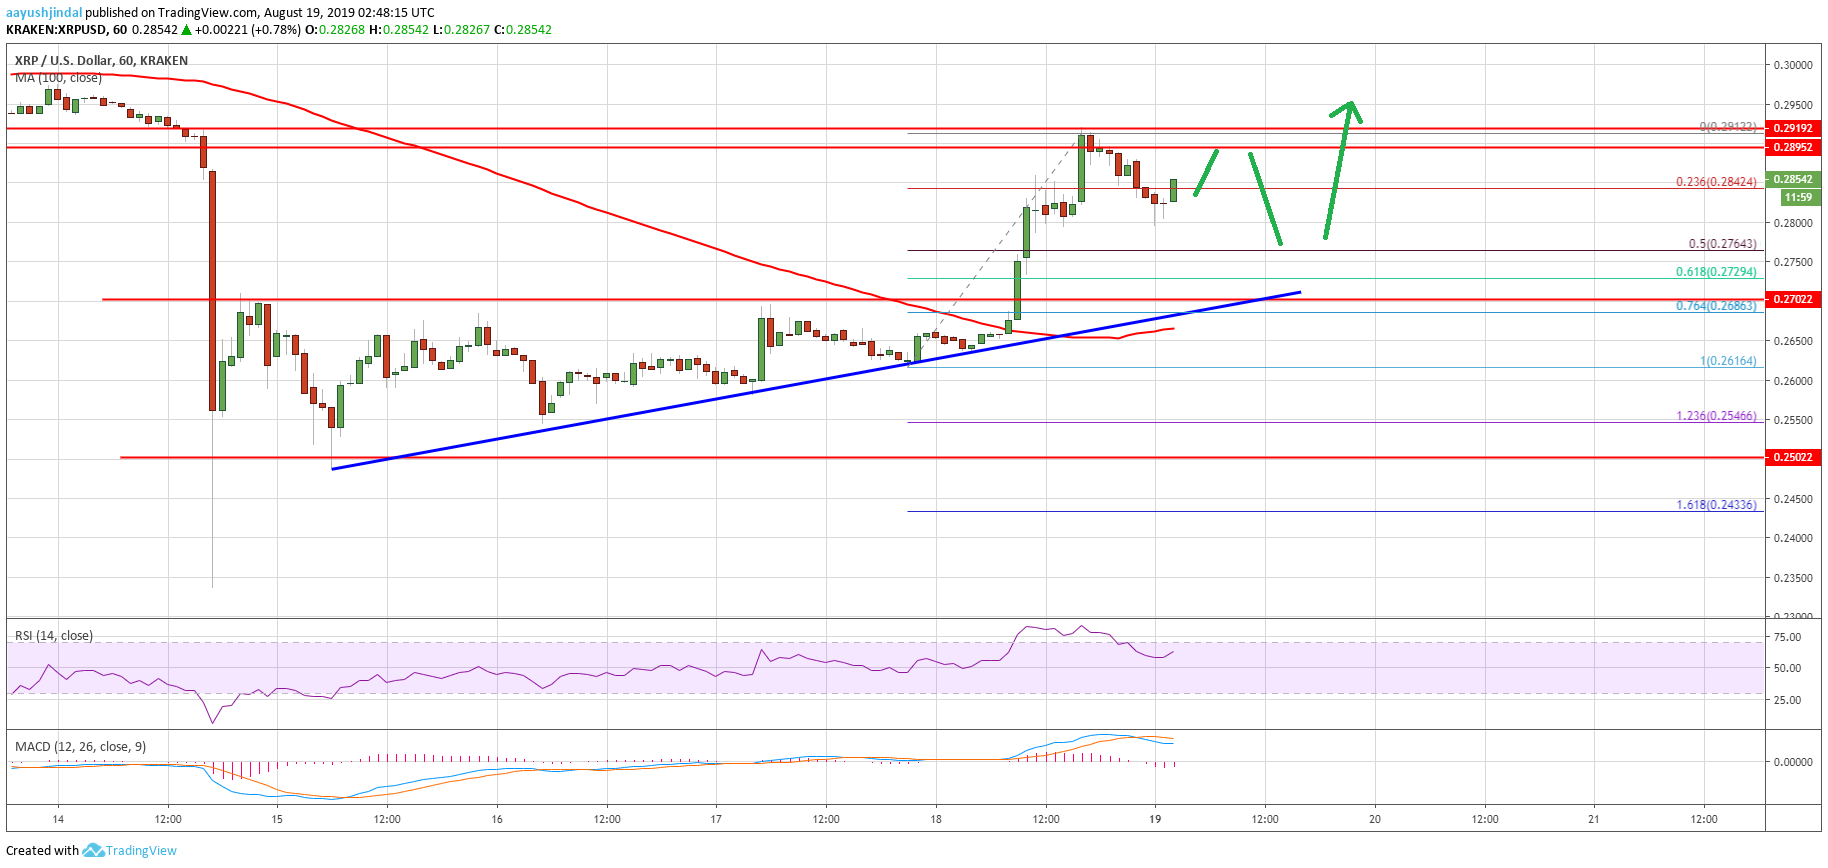 Looking at the chart, ripple price is clearly closing in towards the key barriers near $0.2920. If the price struggles to climb above $0.2920, there could be a downward move towards the $0.2700 level. Conversely, a successful break above $0.2920 could pump the price towards or above $0.3000 in the near term.Technical IndicatorsHourly MACD – The MACD for XRP/USD is slowly moving into the bearish zone.Hourly RSI (Relative Strength Index) – The RSI for XRP/USD is currently placed well above the 50 level.Major Support Levels – $0.2750, $0.2700 and $0.2650.Major Resistance Levels – $0.2900, $0.2920 and $0.3000.The post appeared first on NewsBTC


