
Ripple price is following a bearish path and it recently broke the $0.2700 support against the US dollar.Bitcoin price is down around 8% and it settled below the key $10,000 support area.There is a major declining channel forming with resistance near $0.2680 on the hourly chart of the XRP/USD pair (data source from Kraken).The pair might correct a few points, but upsides are likely to remain capped near $0.2680 and $0.2700.Ripple price is back in a downtrend below $0.2700 against the US Dollar. Bitcoin and Ethereum nosedived recently, putting a lot of pressure on XRP below $0.2650.Ripple Price AnalysisIn the past two days, there was a steady decline in XRP price from the $0.2920 resistance against the US Dollar. The recent decline accelerated after the price broke the key $0.2850 support level. Moreover, the price settled below the $0.2800 level and the 100 hourly simple moving average. It opened the doors for more losses and the price recently declined below the main $0.2700 support.Ripple price traded as low as $0.2581 recently and it is currently consolidating losses. It traded above the $0.2620 level plus the 23.6% Fib retracement level of the downward move from the $0.2749 high to $0.2581 low. However, the price failed to climb above the $0.2660 level. It seems like there are many hurdles forming near the $0.2660, $0.2680 and $0.2700 levels.The recent failure was near the 50% Fib retracement level of the downward move from the $0.2749 high to $0.2581 low. Moreover, there is a major declining channel forming with resistance near $0.2680 on the hourly chart of the XRP/USD pair. Above the channel resistance, the next major resistance is near the $0.2700 level. The 100 hourly SMA is also waiting near the $0.2750 level to prevent gains.On the downside, an immediate support is near the $0.2580 swing low. If there is a downside break below $0.2580, ripple price is likely to revisit the $0.2500 support area. In the mentioned case, there is a risk of more downsides below $0.2500 and the price could trade to a new monthly low.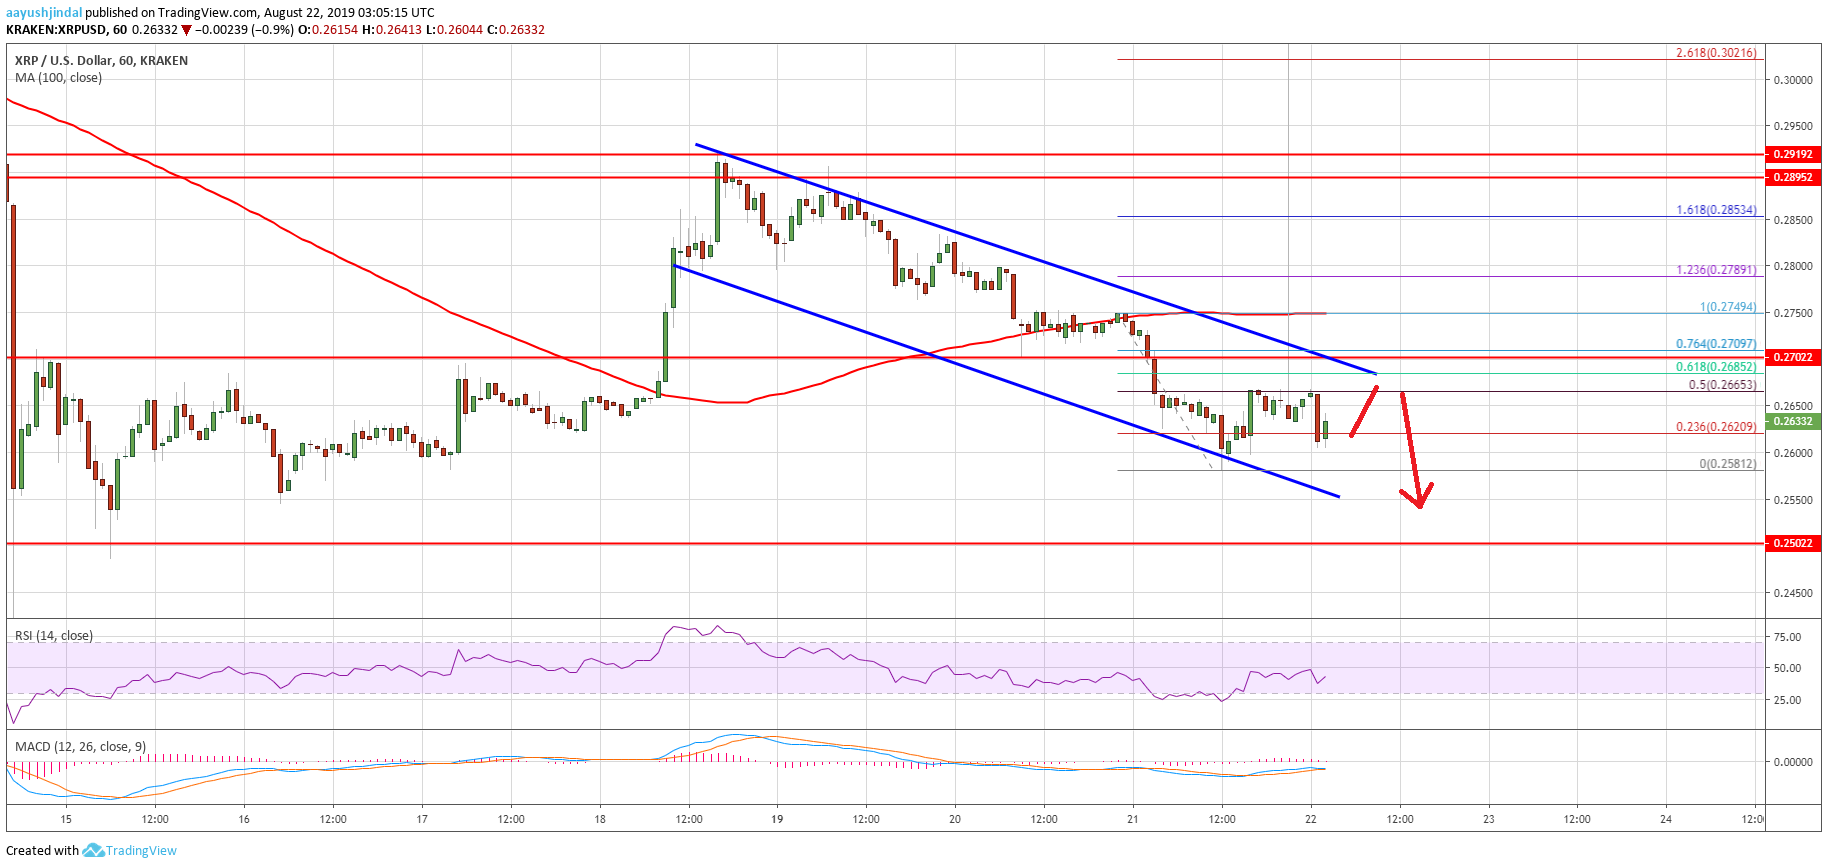 Looking at the chart, ripple price is clearly trading in a bearish zone below the $0.2700 and $0.2750 resistance levels. Therefore, there are high chances of more downsides below $0.2580 and $0.2500 in the near term. Only a close above $0.2750 might negate the current bearish view.Technical IndicatorsHourly MACD – The MACD for XRP/USD is likely to move into the bearish zone.Hourly RSI (Relative Strength Index) – The RSI for XRP/USD is currently well below the 50 level.Major Support Levels – $0.2580, $0.2500 and $0.2420.Major Resistance Levels – $0.2680, $0.2700 and $0.2750.The post appeared first on NewsBTC


