
- Ripple price started an upside correction above the $0.2600 resistance against the US dollar.
- The price is facing a strong selling interest near the main $0.2650 resistance area.
- Yesterday’s highlighted major bearish trend line was breached with resistance near $0.2565 on the hourly chart of the XRP/USD pair (data source from Kraken).
- The price is currently correcting gains and it could find support near the $0.2580 level.
Ripple price is showing positive signs against the US Dollar, while bitcoin rallied 7%. XRP price must climb above the $0.2650 resistance for upside continuation.
Ripple Price Analysis
In the past three sessions, there was a strong upward move in bitcoin above $10,000 and $10,200 against the US Dollar. It helped many altcoins such as Ethereum, ETC, BNB and BCH. Moreover, there were positive signs emerged for ripple and it climbed above the $0.2580 resistance level. XRP price even broke the $0.2600 resistance and the 100 hourly simple moving average.
During the rise, yesterday’s highlighted major bearish trend line was breached with resistance near $0.2565 on the hourly chart of the XRP/USD pair. The pair even broke the $0.2620 resistance area. However, the $0.2650 level acted as a strong resistance (as discussed in yesterday’s analysis). A swing high was formed near $0.2652 and the price is currently correcting gains.
It broke the $0.2620 level plus the 23.6% Fib retracement level of the recent wave from the $0.2511 low to $0.2652 high. On the downside, there is a decent support forming near the $0.2580 level. Additionally, there is a connecting bullish trend line forming with support near $0.2580 on the same chart. Finally, the 50% Fib retracement level of the recent wave from the $0.2511 low to $0.2652 high is also near the $0.2580 level.
Therefore, the $0.2580 level might act as a strong support in the near term. If the price fails to stay above the $0.2580 support, it could test $0.2550 and the 100 hourly SMA. Any further downsides might push the price back towards $0.2500. On the upside, the bulls need to gain momentum above the $0.2620 and $0.2650 resistance levels to push the price further higher.
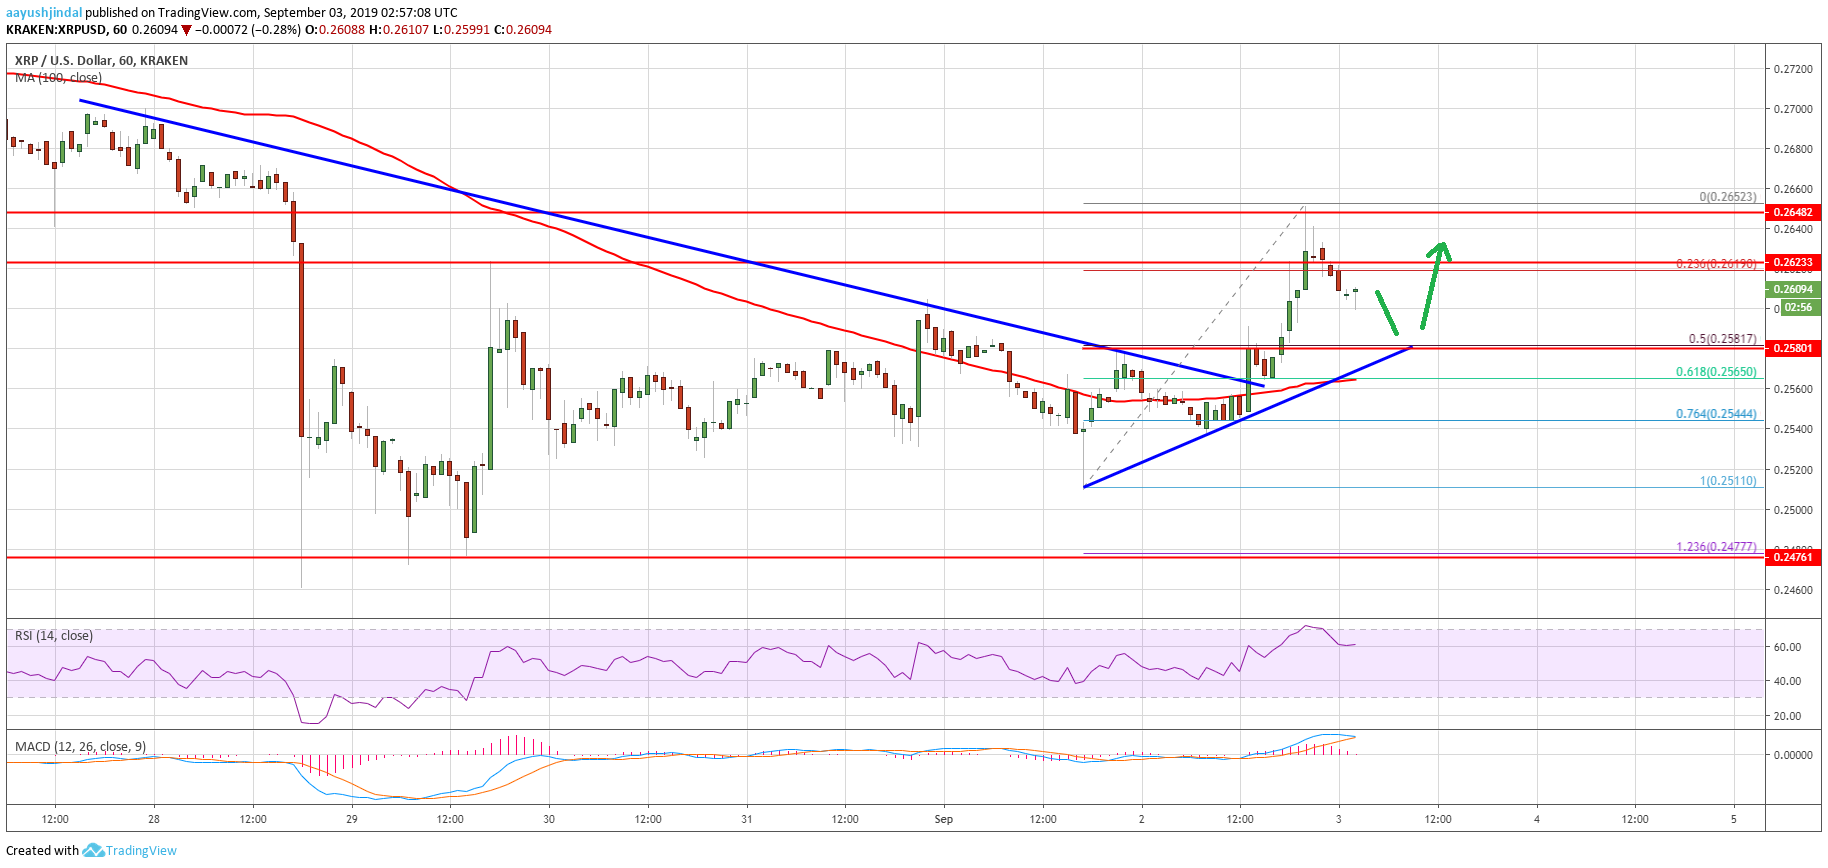
Looking at the chart, ripple price is correcting gains after testing the key $0.2650 resistance area. However, if the $0.2580 support holds the current decline, the price could bounce back. Conversely, the price is likely to extend its decline back towards $0.2500.
Technical Indicators
Hourly MACD – The MACD for XRP/USD is currently reducing its bullish slope, with a few negative signs.
Hourly RSI (Relative Strength Index) – The RSI for XRP/USD is currently flat near the 60 level.
Major Support Levels – $0.2580, $0.2550 and $0.2500.
Major Resistance Levels – $0.2620, $0.2650 and $0.2720.
Ripple Price (XRP) Testing Last Line Of Defense: BTC and ETH Recovering
The post appeared first on Crypto Asset Home


