
Ripple price is slowly rising and it is now trading above $0.1950 against the US dollar.The price seems to be lacking bullish momentum above the $0.1980 and $0.2000.There is a key bullish trend line forming with support near $0.1950 on the hourly chart of the XRP/USD pair (data source from Kraken).Ethereum is showing positive signs and it is likely to continue higher above the $135 resistance.Ripple price is struggling to clear a few key hurdles against the US Dollar, while bitcoin is rallying. XRP price could gain traction once there is a close above $0.2000.Ripple Price AnalysisIn the past few hours, there was a strong rise in bitcoin and Ethereum, but ripple price struggled to catch up against the US Dollar. XRP price formed a decent support near the $0.1900 and recently started a steady rise.Moreover, there was a break above the $0.1940 resistance and the 100 hourly simple moving average. The price traded as high as $0.1988 and it seems like the bulls are lacking strength.A minor correction is underway below $0.1980. An initial support is near the 23.6% Fib retracement level of the recent wave from the $0.1892 low to $0.1988 high. On the downside, there is a decent support forming near the $0.1950 level.Besides, there is a key bullish trend line forming with support near $0.1950 on the hourly chart of the XRP/USD pair. The 50% Fib retracement level of the recent wave from the $0.1892 low to $0.1988 high is near the $0.1940 level.If there is a downside break below $0.1950 and $0.1940, ripple could move back towards the $0.1920 level and the 100 hourly simple moving average. The main support is near the $0.1900 level, below which the price could move back into the positive zone.On the upside, there are a few important hurdles forming near the $0.1980 and $0.2000 levels. A successful break above the $0.2000 level is needed for the bulls to gain strength. The next major resistance is seen near $0.2120 and $0.2150.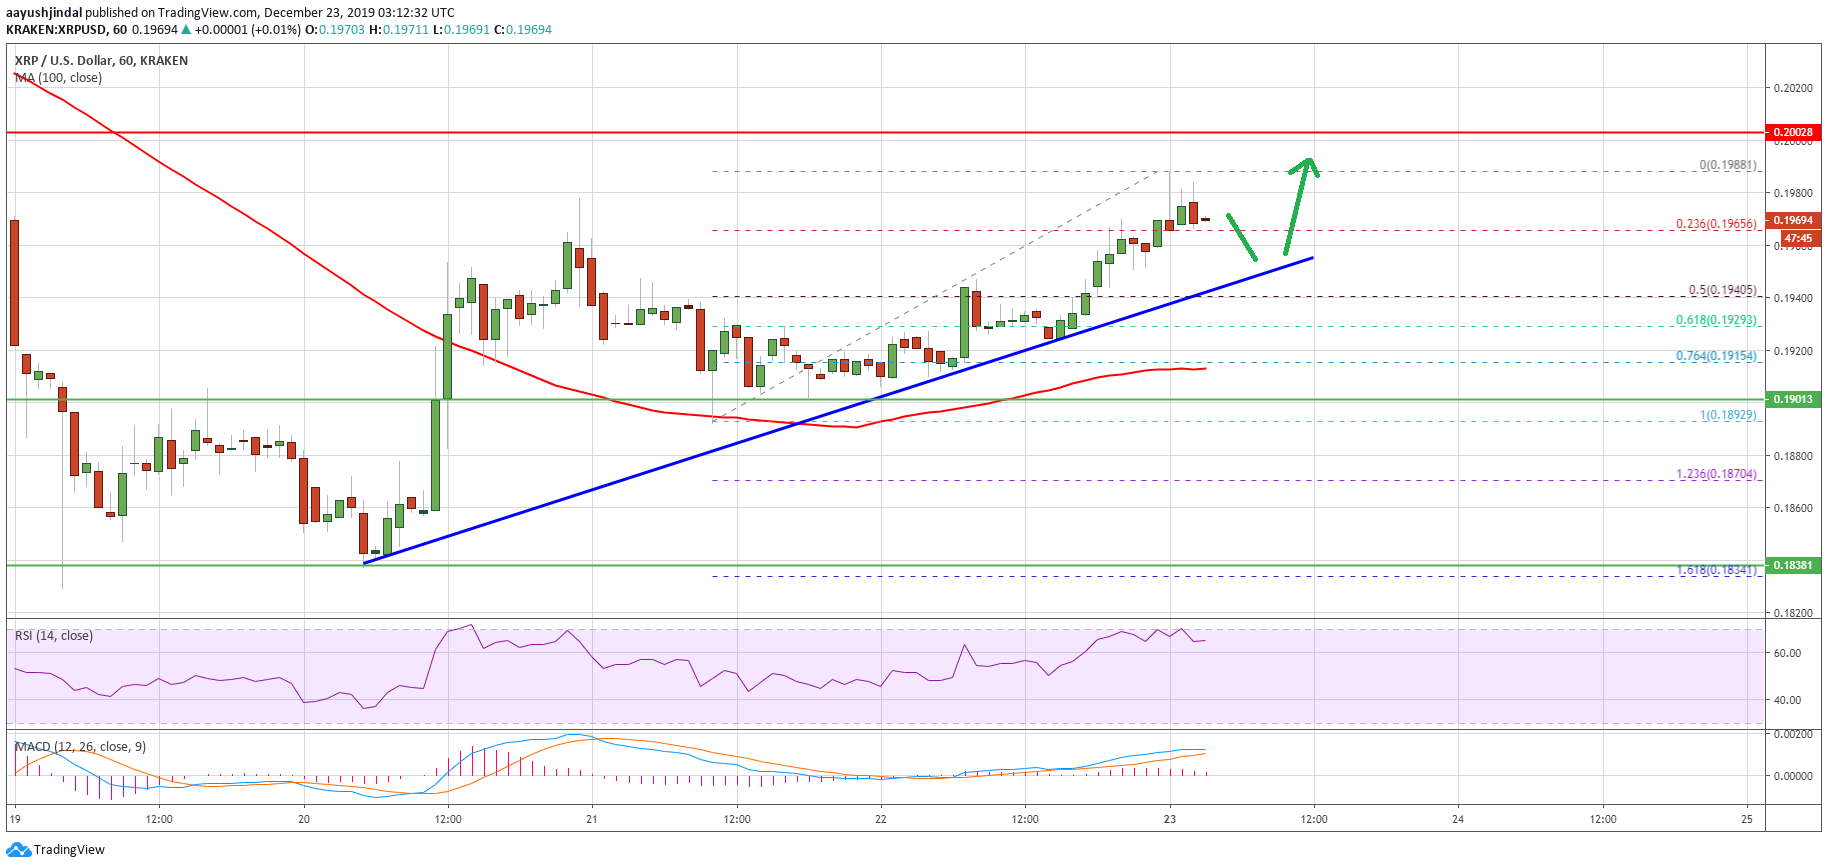 Ripple PriceLooking at the chart, ripple price is clearly lacking momentum compared to bitcoin and Ethereum. However, if the price succeeds in clearing the $0.2000 hurdles, the bulls are likely to take over and the price could rally above $0.2100.Technical IndicatorsHourly MACD – The MACD for XRP/USD is about to move back into the bearish zone.Hourly RSI (Relative Strength Index) – The RSI for XRP/USD is well above 50 and it is currently lower.Major Support Levels – $0.1950, $0.1940 and $0.1900.Major Resistance Levels – $0.1980, $0.2000 and $0.2050.The post appeared first on NewsBTC


