
Ripple price is still trading in the red zone below the $0.2000 resistance against the US dollar.The price is declining and it could soon break the $0.1840 support area to continue lower.This week’s key bearish trend line is still active with resistance near $0.2055 on the hourly chart of the XRP/USD pair (data source from Kraken).A clear break below $0.1840 and $0.1800 might push the price to a new monthly low.Ripple price is showing bearish signs against the US Dollar, while bitcoin and Ethereum are in the green zone. XRP price remains at a risk of more losses below $0.1800.Ripple Price AnalysisYesterday, we saw a sharp increase in bitcoin and most major altcoins, but ripple struggled gain strength above $0.1900 against the US Dollar. XRP price traded above the $0.1920 and $0.1950 resistance levels, but it lacked bullish momentum.The price failed to continue above the $0.2000 resistance and remained well below the 100 hourly simple moving average. A swing high is formed near $0.2007 and the price is currently correcting lower.It broke the $0.1950 support area. Besides, the price traded below the 50% Fib retracement level of the recent upward move from the $0.1739 low to $0.2007 high.On the downside, there are important supports near the $0.1850 and $0.1840 levels. The 61.8% Fib retracement level of the recent upward move from the $0.1739 low to $0.2007 high is also near the $0.1840 level.Therefore, a downside break below the $0.1840 support could start another decline. The next major support is near the $0.1800 level, below which ripple price will most likely break the $0.1739 low.Any further losses might lead the price towards the $0.1650 level. On the upside, there are many hurdles near the $0.1940 and $0.1950 levels. The main hurdle is still near the $0.2000 area.Additionally, this week’s key bearish trend line is still active with resistance near $0.2055 on the hourly chart of the XRP/USD pair. A successful close above $0.2000 and the bearish trend line is needed for a decent upward move in the near term.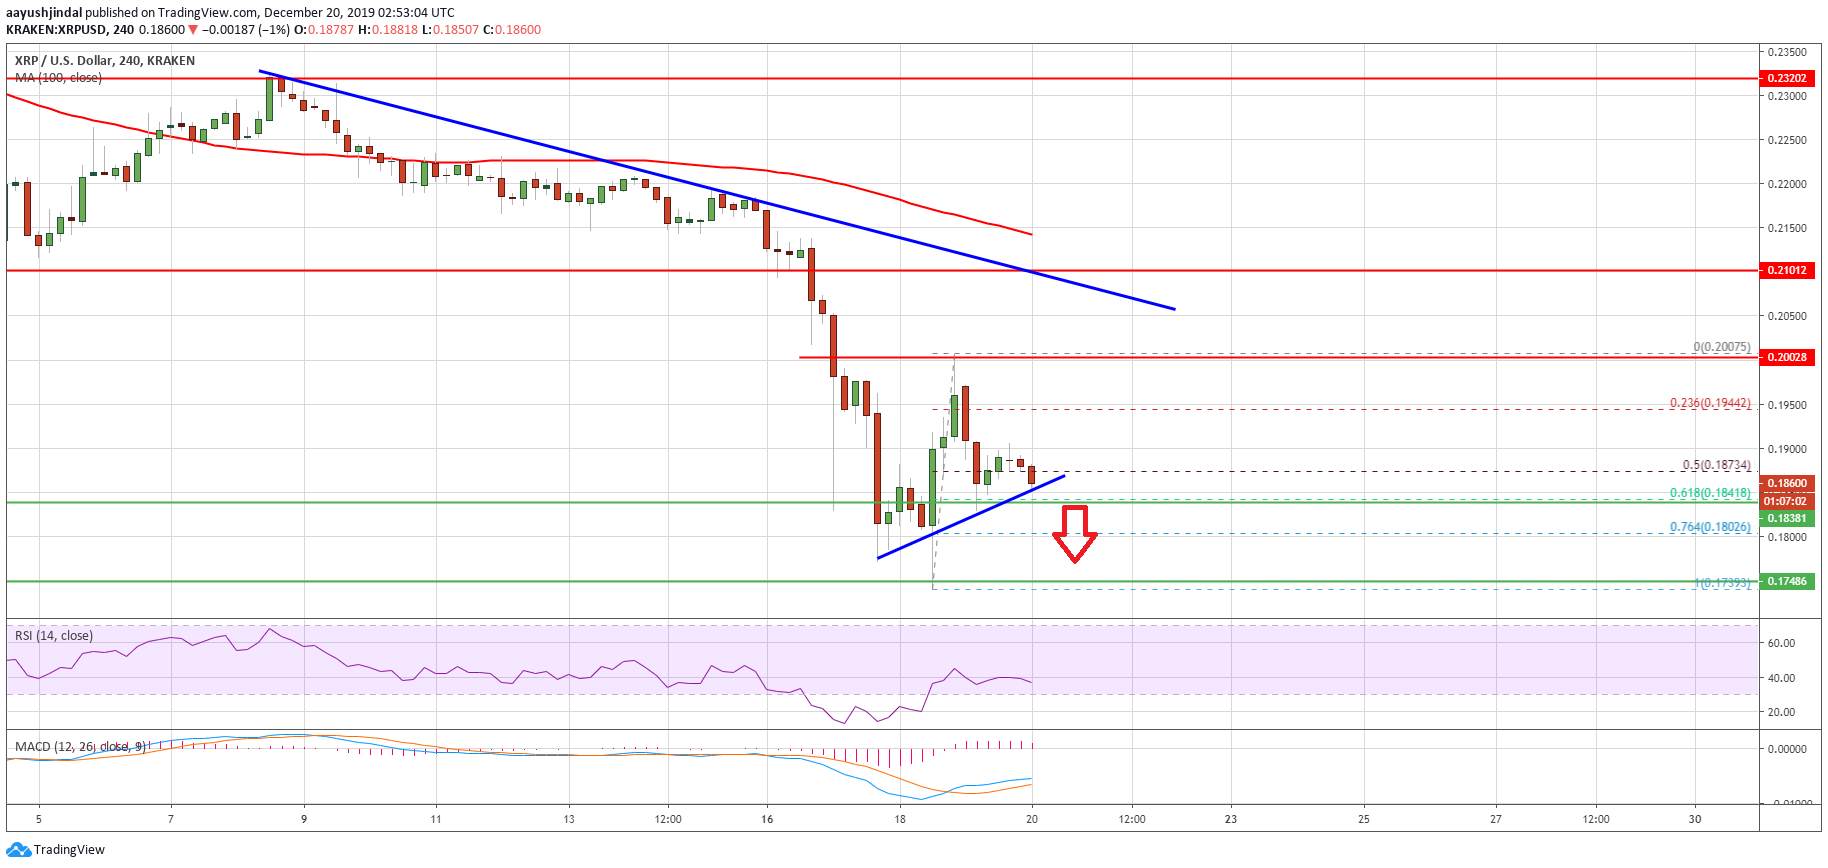 Ripple PriceLooking at the chart, ripple price is clearly moving in the bearish zone below $0.1900. If there is a downside break below $0.1840, the price is likely to accelerate lower in the near term below $0.1800 and $0.1750. The main support is now near $0.1650.Technical IndicatorsHourly MACD – The MACD for XRP/USD is about to move back into the bearish zone.Hourly RSI (Relative Strength Index) – The RSI for XRP/USD is now well below the 40 level.Major Support Levels – $0.1850, $0.1840 and $0.1800.Major Resistance Levels – $0.1950, $0.2000 and $0.2050.The post appeared first on NewsBTC


