
Bitcoin’s market cap was continuing to hit new ATHs, with the same climbing to $344 billion, at the time of writing. In fact, the same had even surpassed the previous ATH of $328 billion achieved back in late-2017.
Some of the market’s altcoins saw surges corresponding to the positive sentiment in the market. For instance, Stellar Lumens saw heavy buying in recent days. Further down the crypto-ladder, Ontology was on a strong uptrend but it was due for a pullback, while Enjin Coin could see a drop in price over the coming days.
Stellar Lumens [XLM]
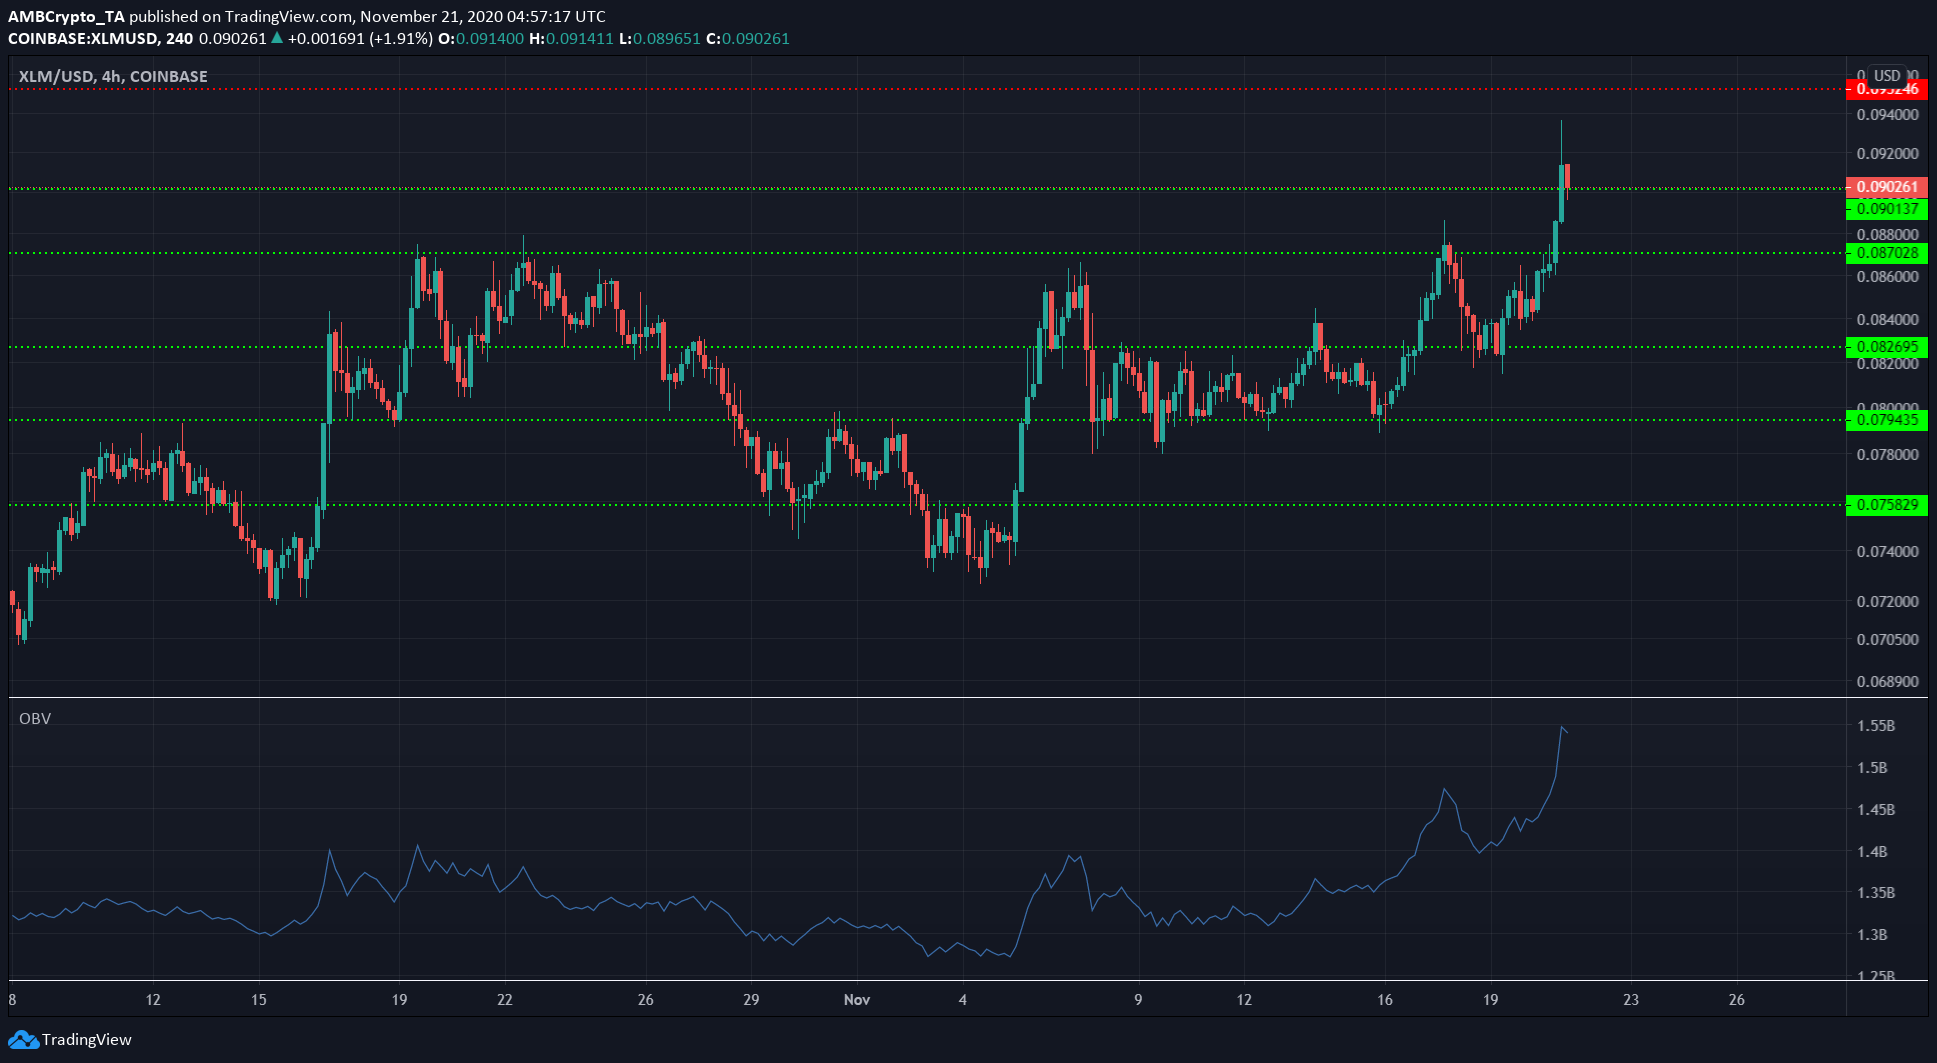
Source: XLM/USD on TradingView
Just like the surge in early July for XLM, the most recent surge for XLM was backed by strong buying volume. The cryptocurrency’s price ascended past the level of resistance at $0.09, but it might be unable to hold on since it is due for a pullback soon.
However, XLM can be expected to post further gains in the coming days. The next levels of resistance lay at $0.095 and $0.1, although whether XLM can reach those targets will also be influenced by Bitcoin’s price over the coming weeks.
Ontology [ONT]
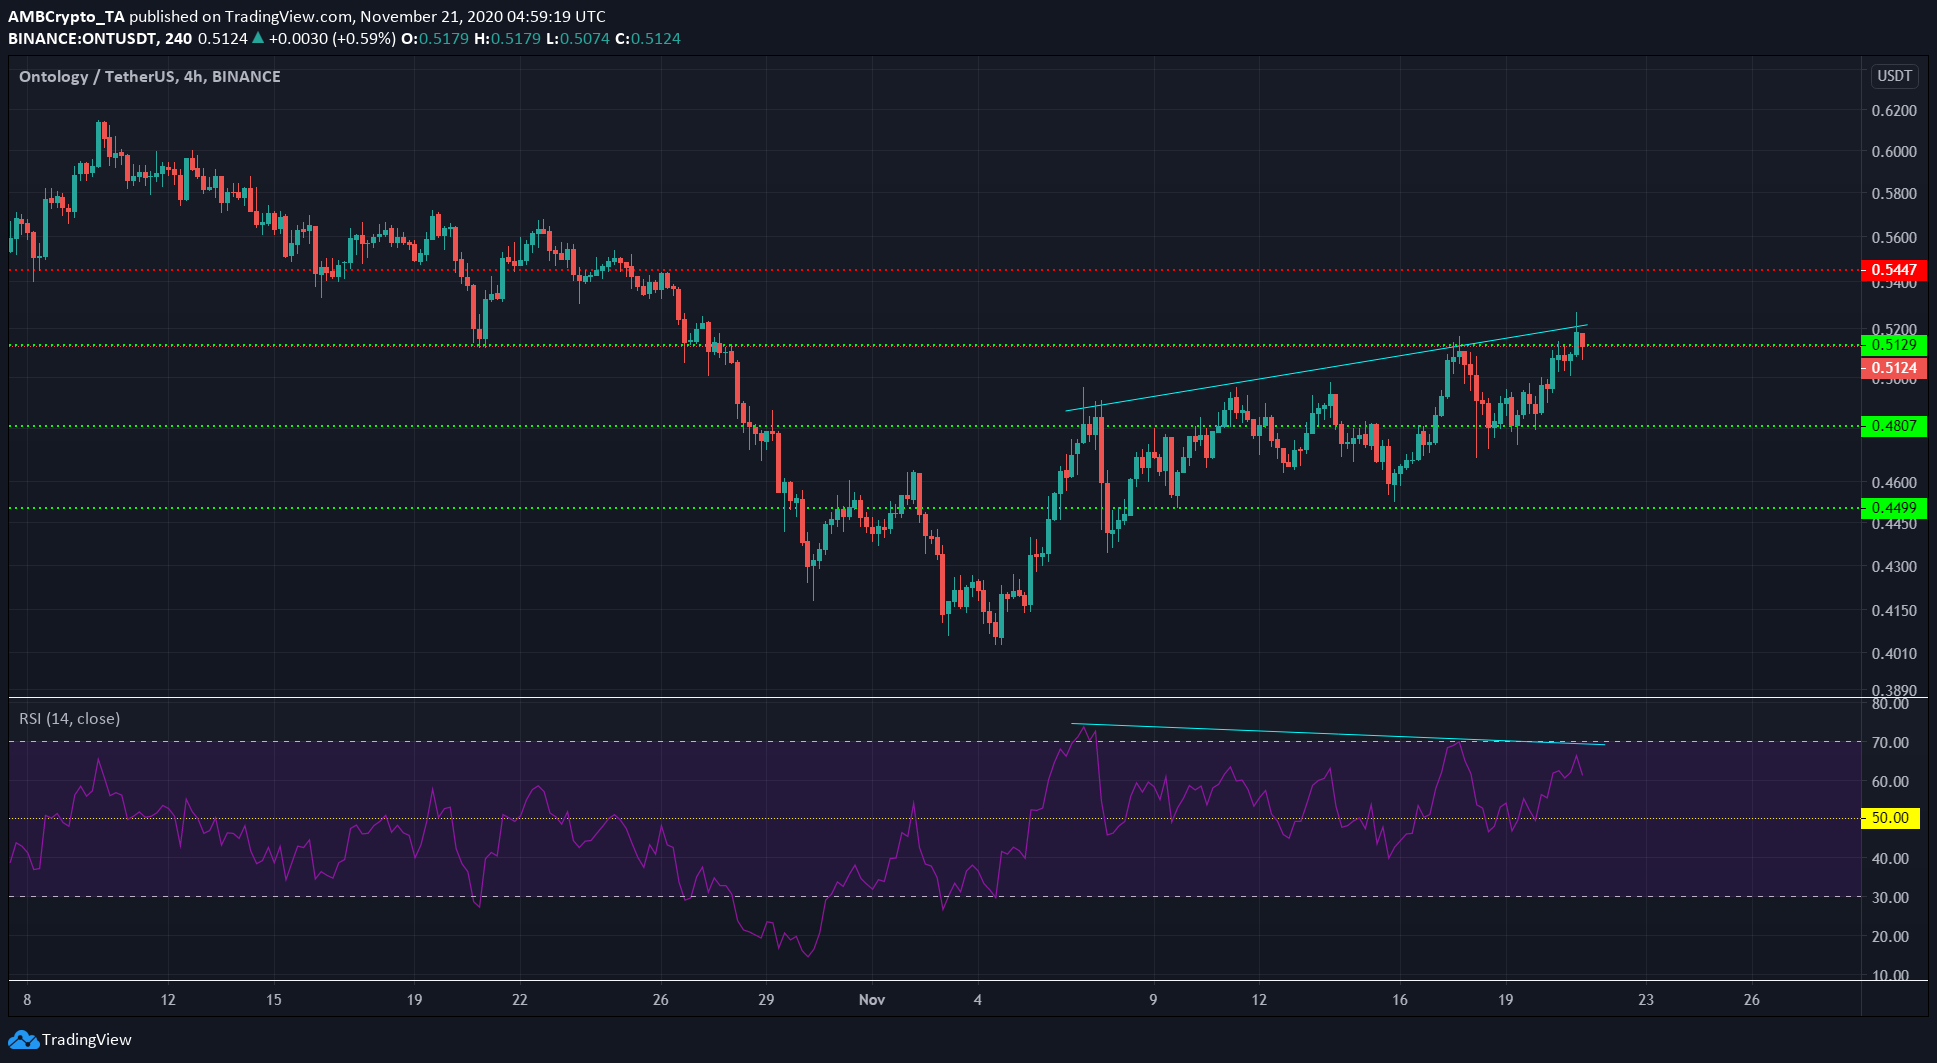
Source: ONT/USDT on TradingView
Ontology was on an uptrend after sinking to as low as $0.4 earlier this month. And yet, the price exhibited a bearish divergence even as it climbed past a level of resistance at $0.513.
This did not indicate an immediate pullback to the previous support at $0.48. In fact, it underlined the possibility that ONT could offer a better price to buyers in the coming days.
A region of demand would be at $0.48, marking it as a good area to enter a trade if ONT does note a pullback.
Enjin [ENJ]
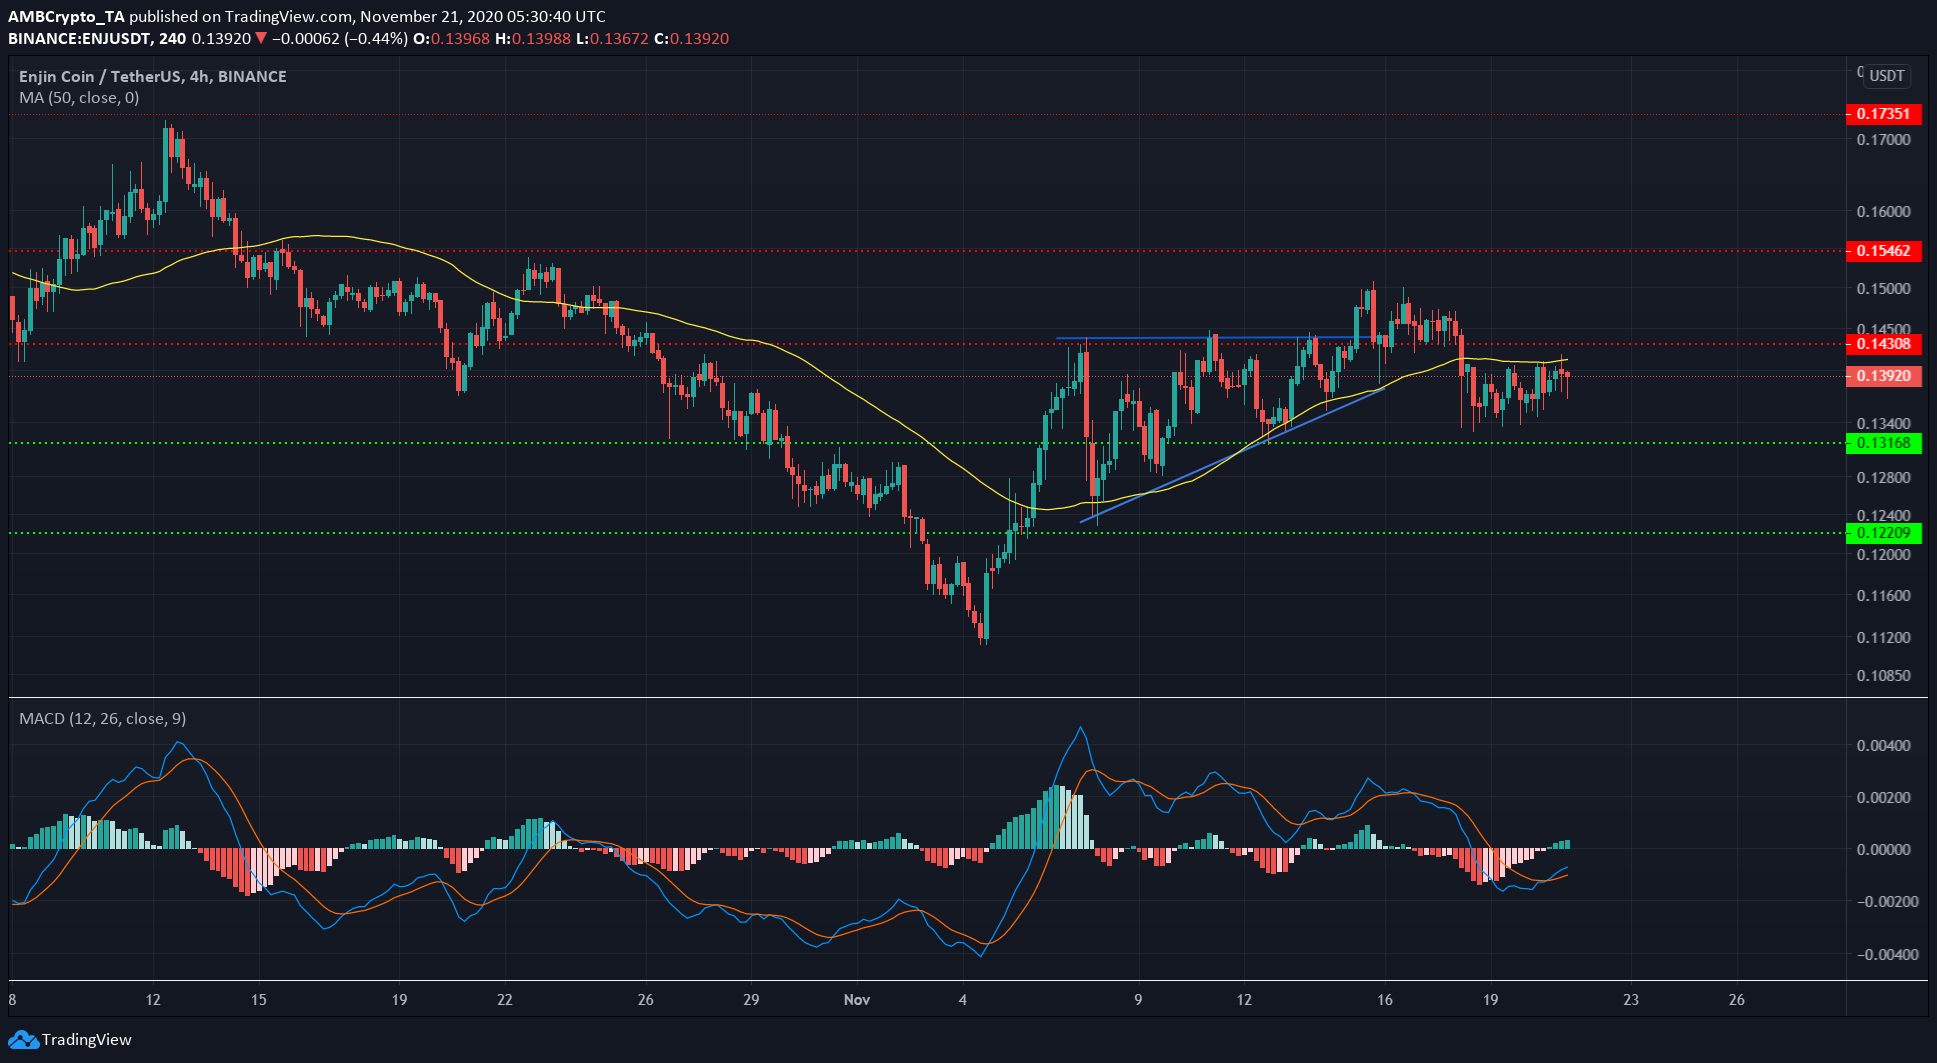
Source: ENJ/USDT on TradingView
ENJ formed an ascending triangle on the charts, but the pattern was busted when an upward breakout was met by strong selling pressure.
The price was forced back under the level at $0.143 and was also trading beneath its 50-period moving average. The SMA can also be expected to act as resistance.
A busted triangle pattern such as this could see ENJ drop to the base of the pattern in the coming days, which would be $0.125.
The post appeared first on AMBCrypto


