
Bitcoin was trading just under the $16,000-level, having not yet offered a significant pullback for traders and investors to buy as it thundered past the $13k and $14k-levels. Tezos formed a bearish pattern that projected a near 10% loss for the coin in the coming days, while Decred made massive gains recently. Augur also formed a bullish pattern on the charts.
Tezos [XTZ]
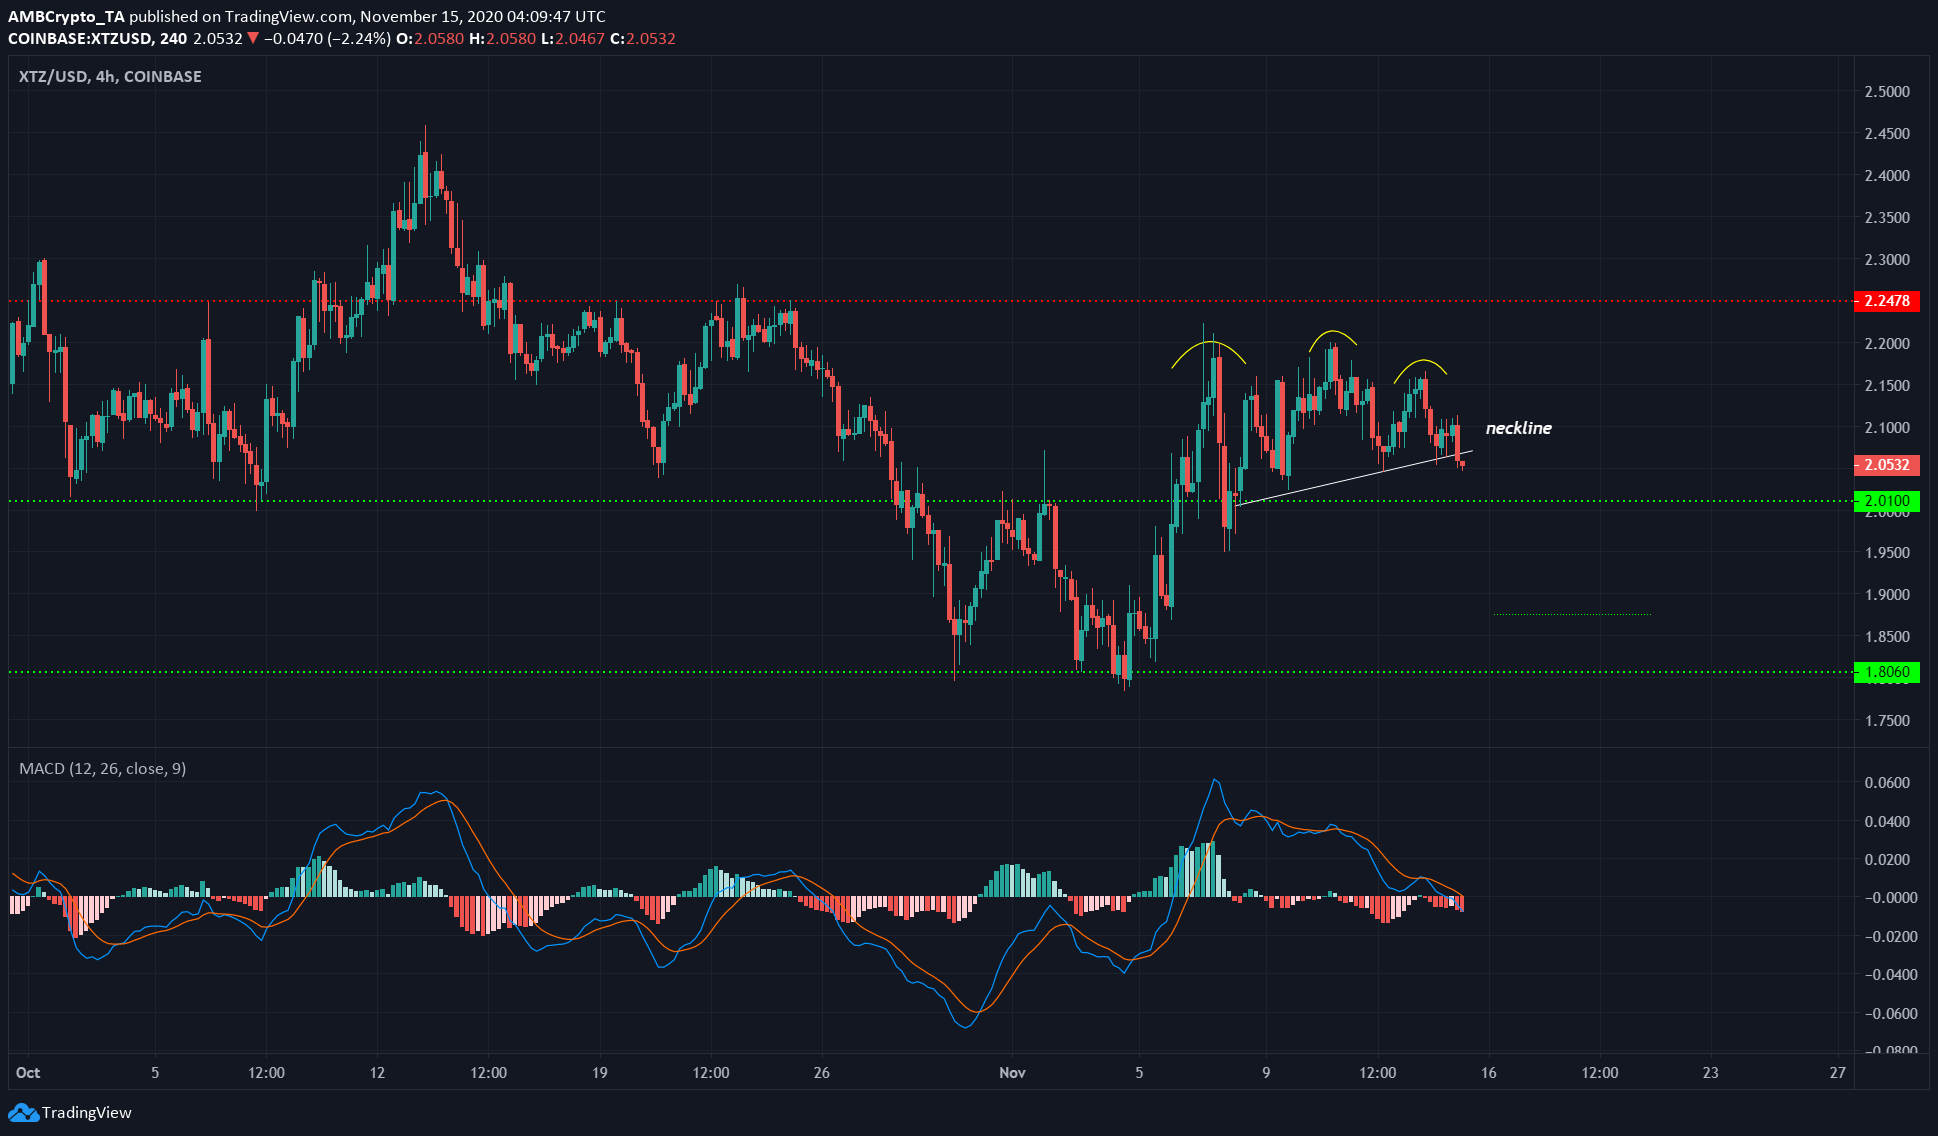
Source: XTZ/USD on TradingView
Tezos formed a head and shoulders pattern and the price broke under the neckline, and could possibly retest the neckline before another descent.
This is a bearish pattern, one that projects a target equal to the height of the head from the neckline, one which projected $1.85 as a downside target for XTZ over the next few days.
The MACD also signaled a shift in momentum to bearish since it recently formed a bearish crossover and was heading under zero, at press time.
Augur [REP]
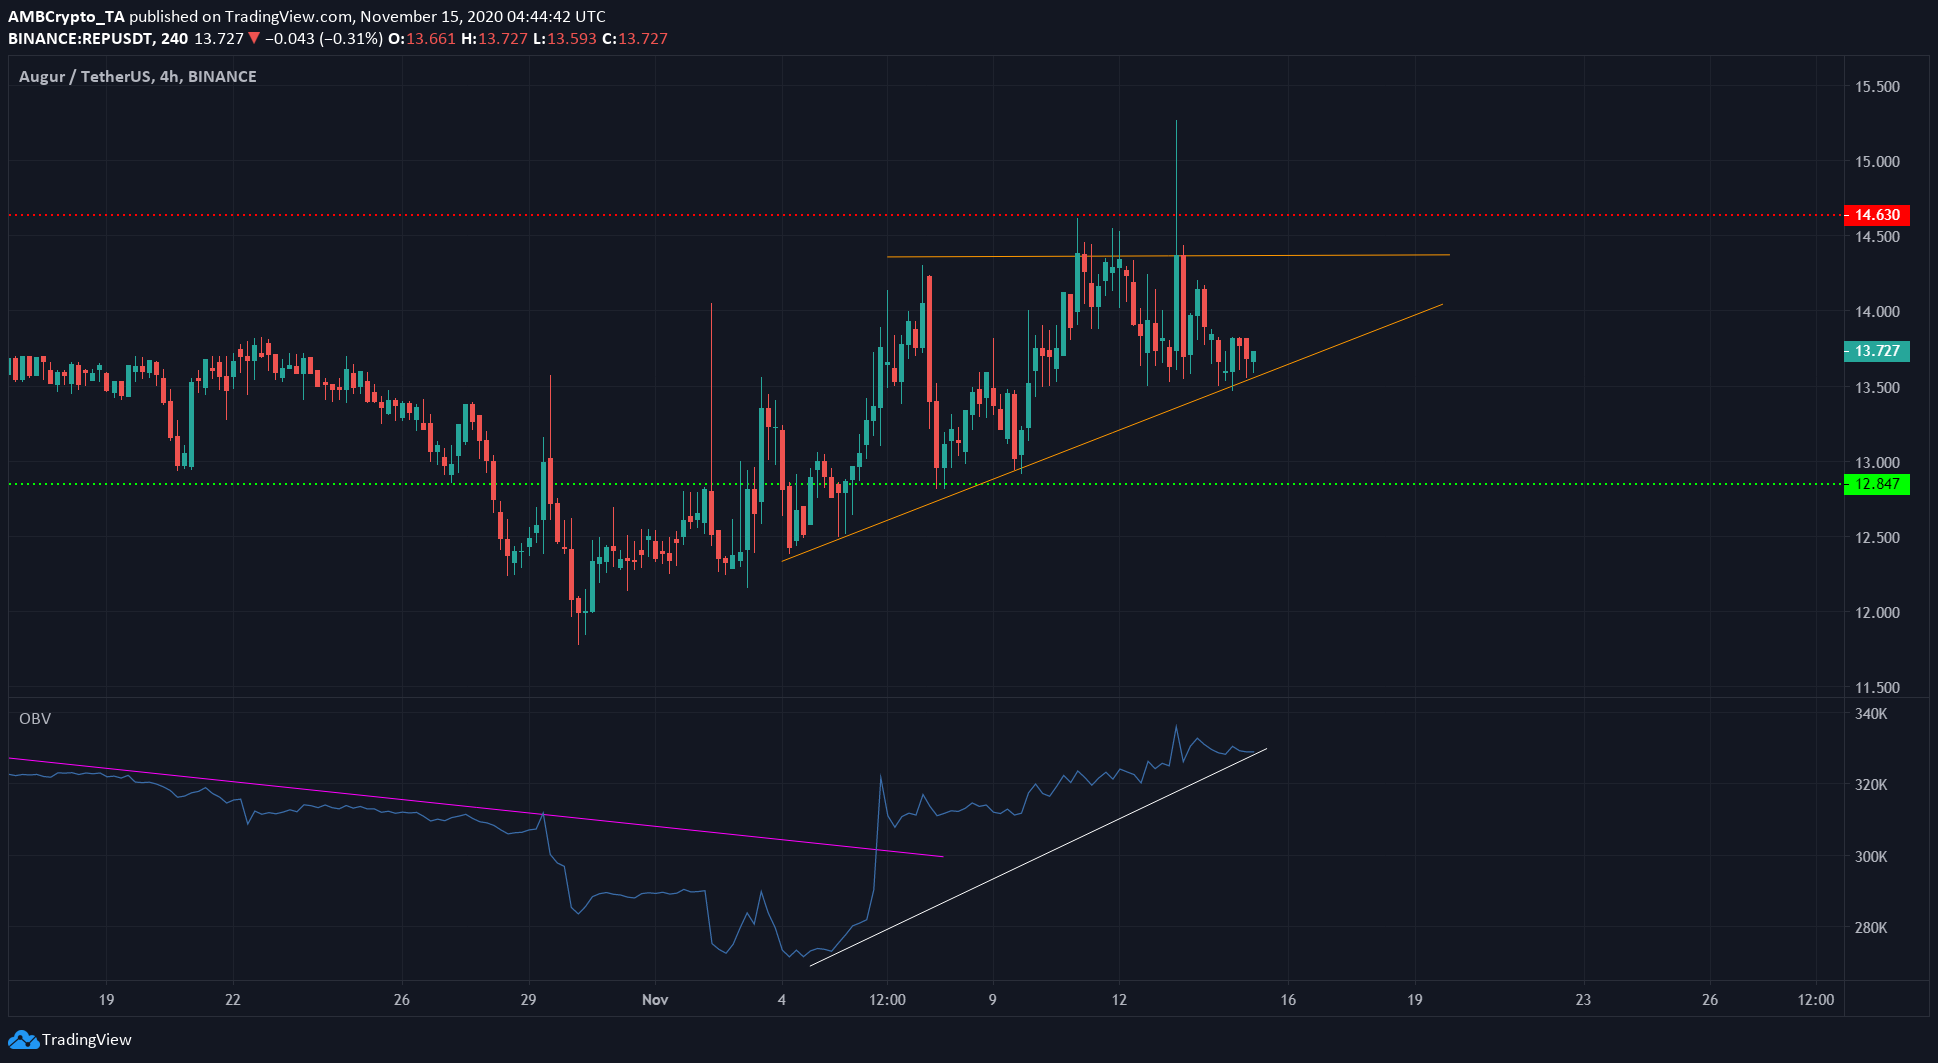
Source: REP/USDT on TradingView
REP formed an ascending triangle (orange) while its OBV was also forming a series of higher lows (white) to indicate the presence of buyer interest. The OBV had been on a long-term downtrend (pink) recently, one which it broke out of following the recent surge.
A close below the triangle pattern would signal an invalidation of the bullish pattern.
As long as the pattern is in play over the next few days, it can be expected that REP would continue to register higher lows and break out and flip the resistance at the $14.6-level.
Decred [DCR]
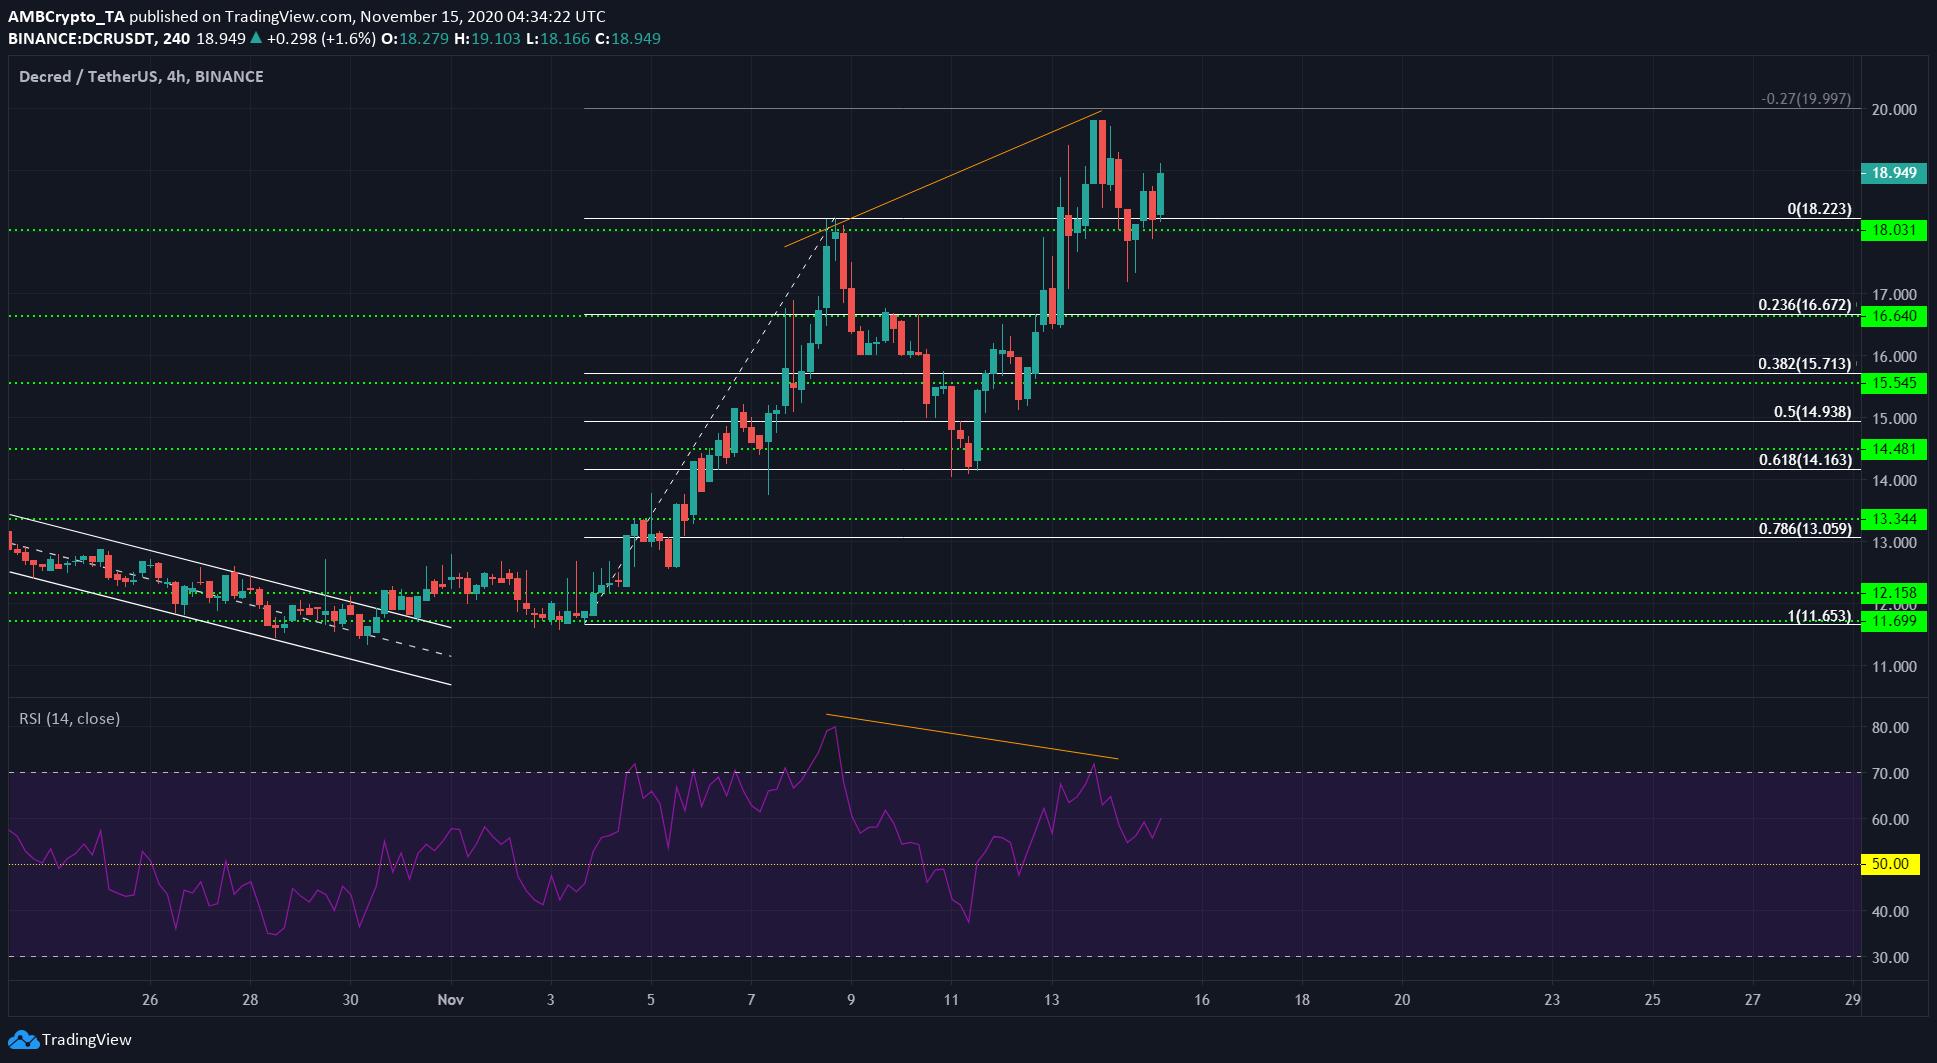
Source: DCR/USDT on TradingView
Decred shot upwards to register gains worth 56% in 5 days while on its move from $11.6 t0 $18.2, before retracing 61.8% of the move to find support at the $14.16-level again.
Using the Fibonacci Retracement tool for this move, possible upside targets were shown for DCR after it rose higher than its previous high at $18.2.
While a bearish divergence (orange) was seen and DCR pulled back to its previous support, it could be set for another northbound journey as the RSI was still above 50 and signaled that an uptrend was in progress.
Upside targets for DCR would be $20 and $22.23 above it, which are the 27% and 61% extensions of DCR’s rise from $11.6 to $18.2.
The post appeared first on AMBCrypto


