
Bitcoin’s price has been trading in a very tight range for a while now. The cryptocurrency seems unable to break out in any directions, while in the meantime, altcoins are popping massively.
This has led to a 3% decrease in Bitcoin’s dominance, which measures the share of BTC relative to the entire market capitalization.
However, BTC’s Bollinger Bands, an indicator that measures the standard deviation from a moving average, are particularly squeezed. In fact, the last time this happened, Bitcoin plunged to around $3,000 shortly after.
Bitcoin’s Bollinger Bands Incredibly Tight
The Bollinger Bands, as CryptoPotato explained, are an essential indicator that measures the standard deviation of an asset from a given moving average.
Another way to look at this is as an indicator of volatility. Put simply, the broader the bands are spaced between each other, the higher the volatility is and vice-versa. Currently, the bands are particularly squeezed, giving merit to the narrative that Bitcoin’s unable to break out of its trading range.
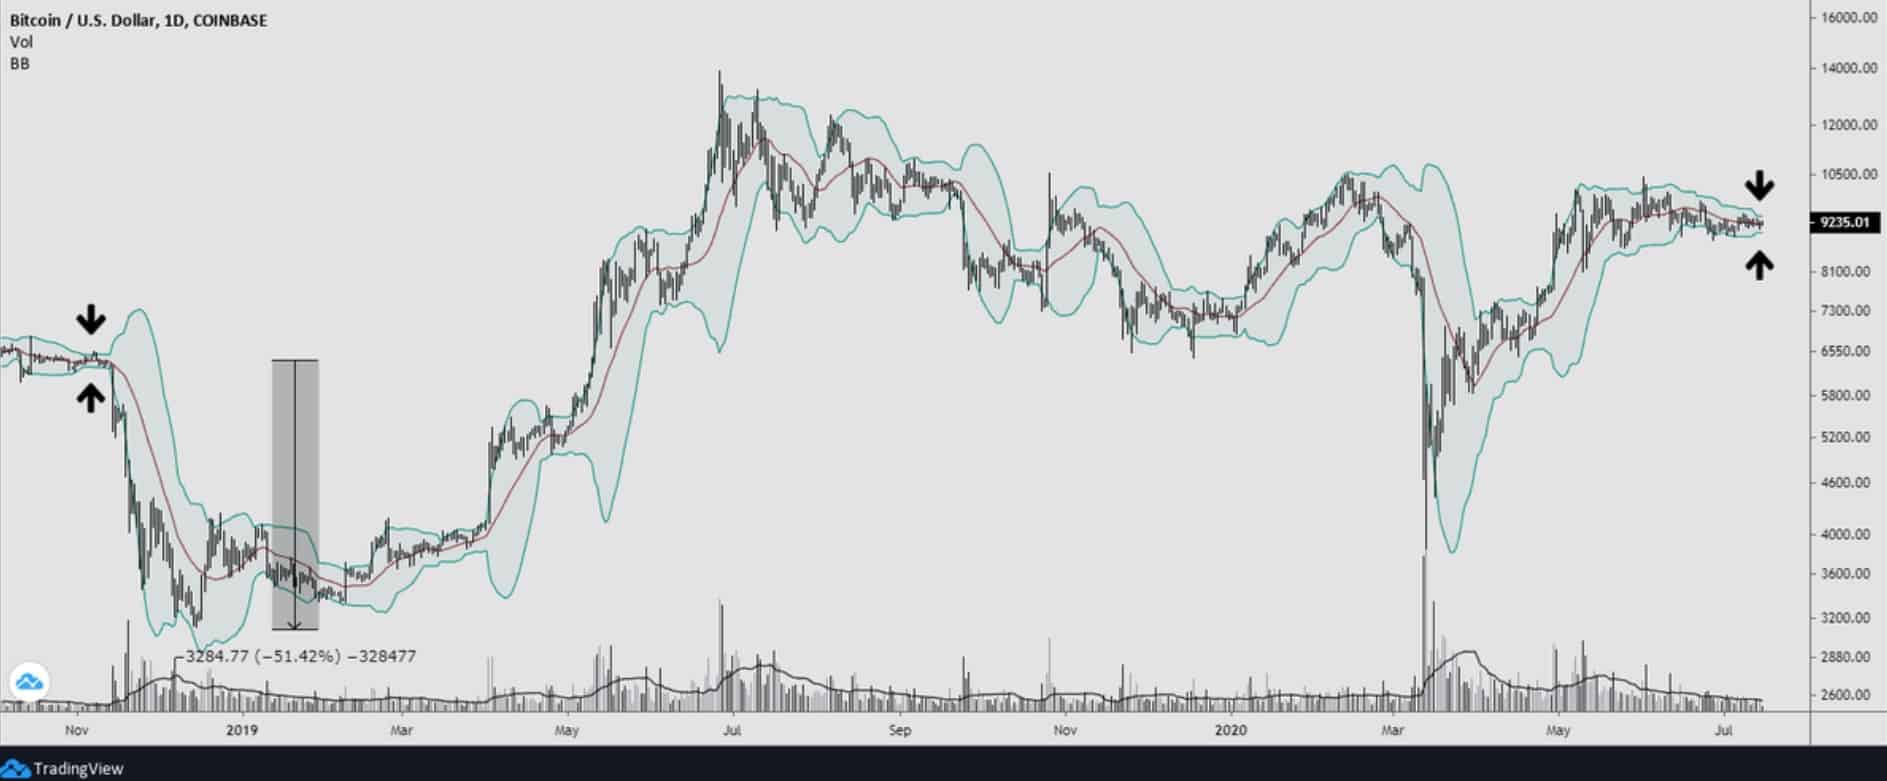
However, it’s worth looking at this indicator from a historical perspective. The last time Bollinger Bands were so tight was all the way back in November 2018. Almost immediately after, the price nosedived 51% towards the low $3,000’s.
Time to Be Very Careful
One of the important things to keep in mind is that past performance isn’t an indicator of future events. In other words, just because last time the Bollinger Bands were so squeezed BTC’s price dropped, it doesn’t necessarily mean that the upcoming movement will be bearish. In 2016, for example, when the pattern was similar, Bitcoin initiated a strong bullish cycle.
However, given the current state of the market where most of the action falls on altcoins, traders need to approach the situation with increased cautiousness.
Well-known trader and respected analyst, DYOUrangutang, pointed out on Twitter that “volatility is going to cause panic across the market.”
The tightest BB pinch since Nov ’18.
Be careful if you are sitting in a lot of alts – the volatility is going to cause panic across the market.
Whatever direction this chooses, I expect alts to resume their rallies afterwards. Bias is bullish. – He said.
As CryptoPotato reported earlier this week, a massive move in the price of Bitcoin may quickly halt the ongoing altcoin season, as it’s almost always the case.
Click here to start trading on BitMEX and receive 10% discount on fees for 6 months.
The post appeared first on CryptoPotato


 Capital Inflows Pales in Comparison to Bitcoin (BTC)")
