
XRP/USD – Bulls Struggling To Break 100-days EMA Resistance
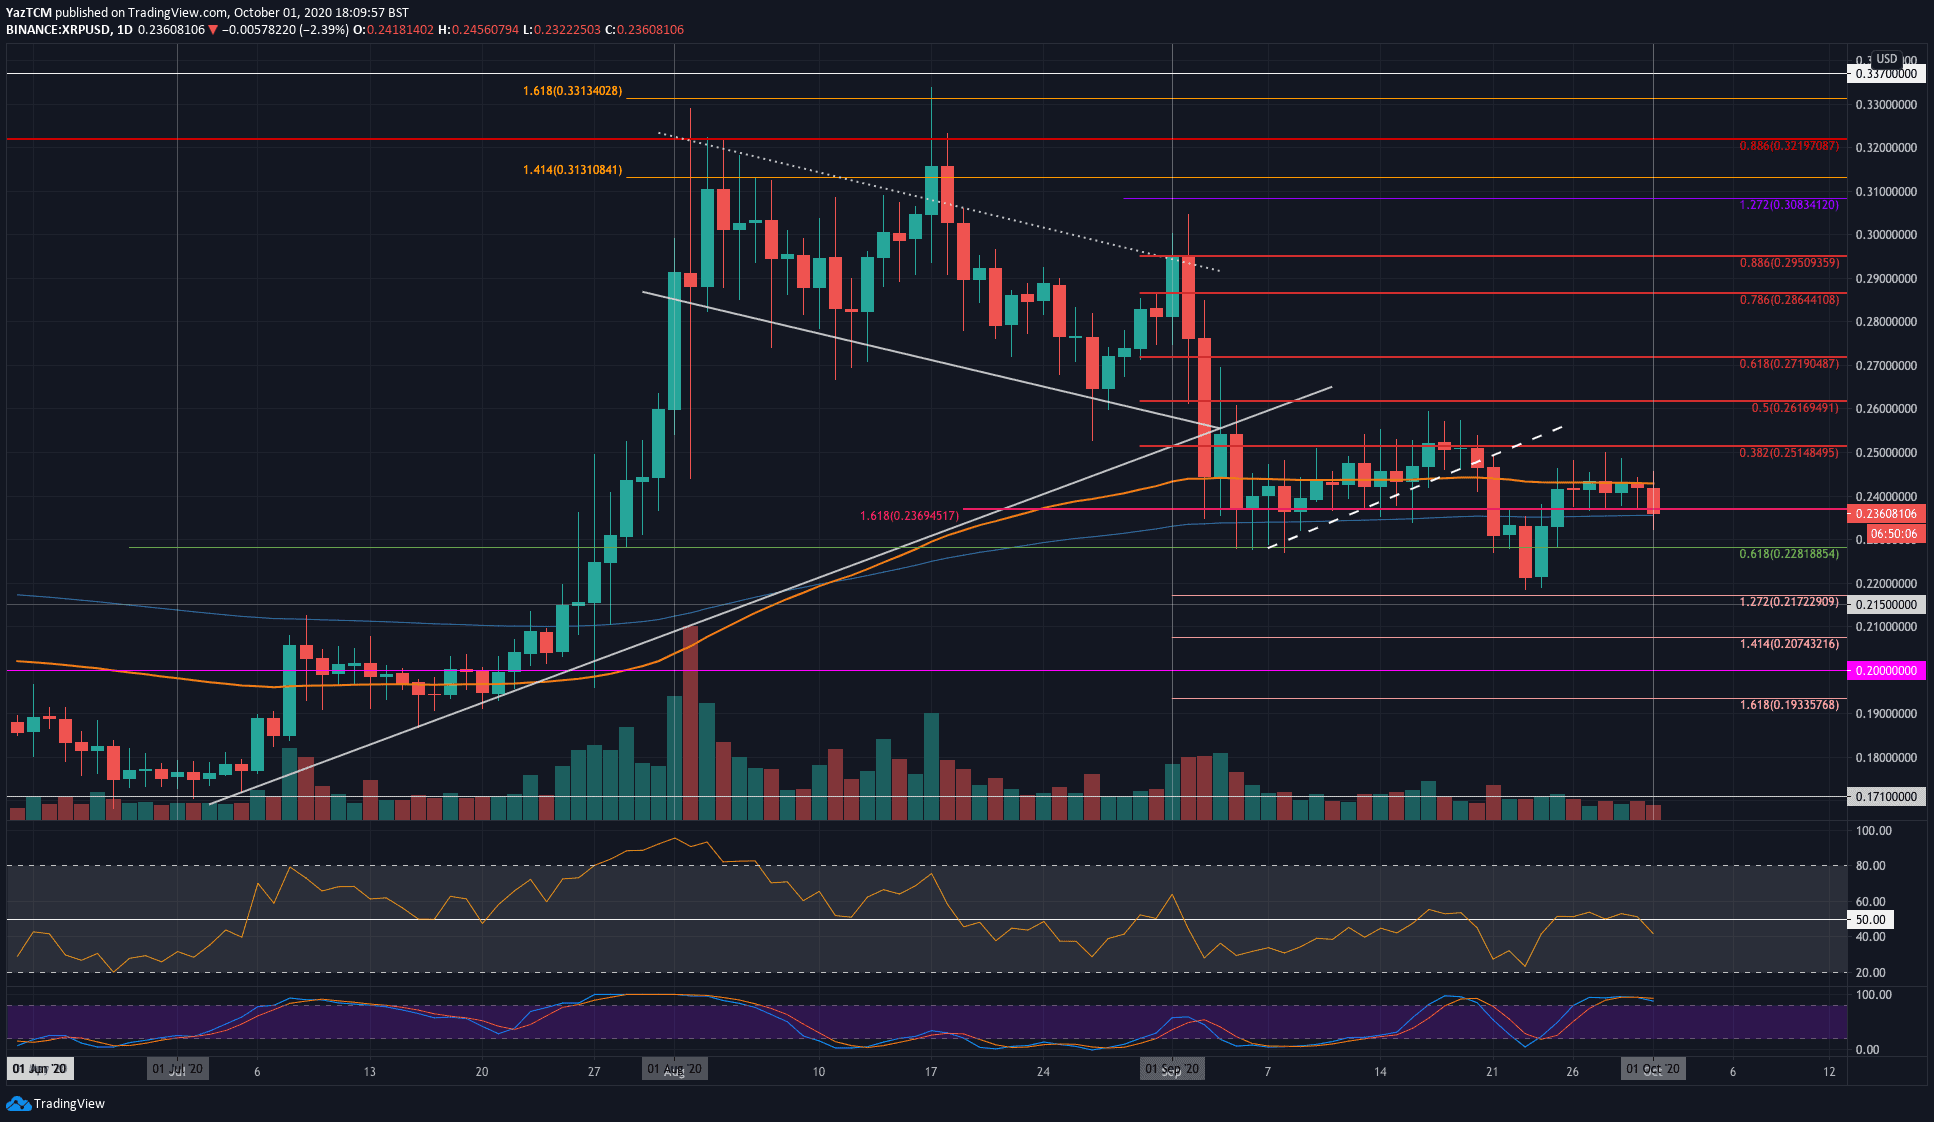
Key Support Levels: $0.236, $0.228, $0.22.
Key Resistance Levels: $0.251, $0.61, $0.271.
Since rebounding from $0.22 last week, the bulls managed to push higher and reach the resistance at the 100-days EMA at around $0.245. Unfortunately, the buyers have failed to break this resistance over the past six days of trading.
The bulls have indeed managed to spike above the resistance. However, they have failed on each day to produce a closing candle above the 100-days EMA. Despite this, the coin remains supported at the $0.236 level (200-days EMA) and has dropped here today with the recent 2.2% price fall.
XRP-USD Short Term Price Prediction
If the bulls can break the 100-days EMA, the first level of resistance lies at $0.251 (bearish .382 Fib Retracement). Above this, resistance lies at $0.261 (bearish .5 Fib Retracement), $0.271 (bearish .618 Fib Retracement), and $0.28.
On the other side, the first level of support lies at $0.236 (200-days EMA). Beneath this, support lies at $0.0228 (.618 Fib Retracement), $0.22, and $0.215.
The RSI is in a state of indecision while the Stochastic RSI trades in overbought conditions and is primed for a bearish crossover signal.
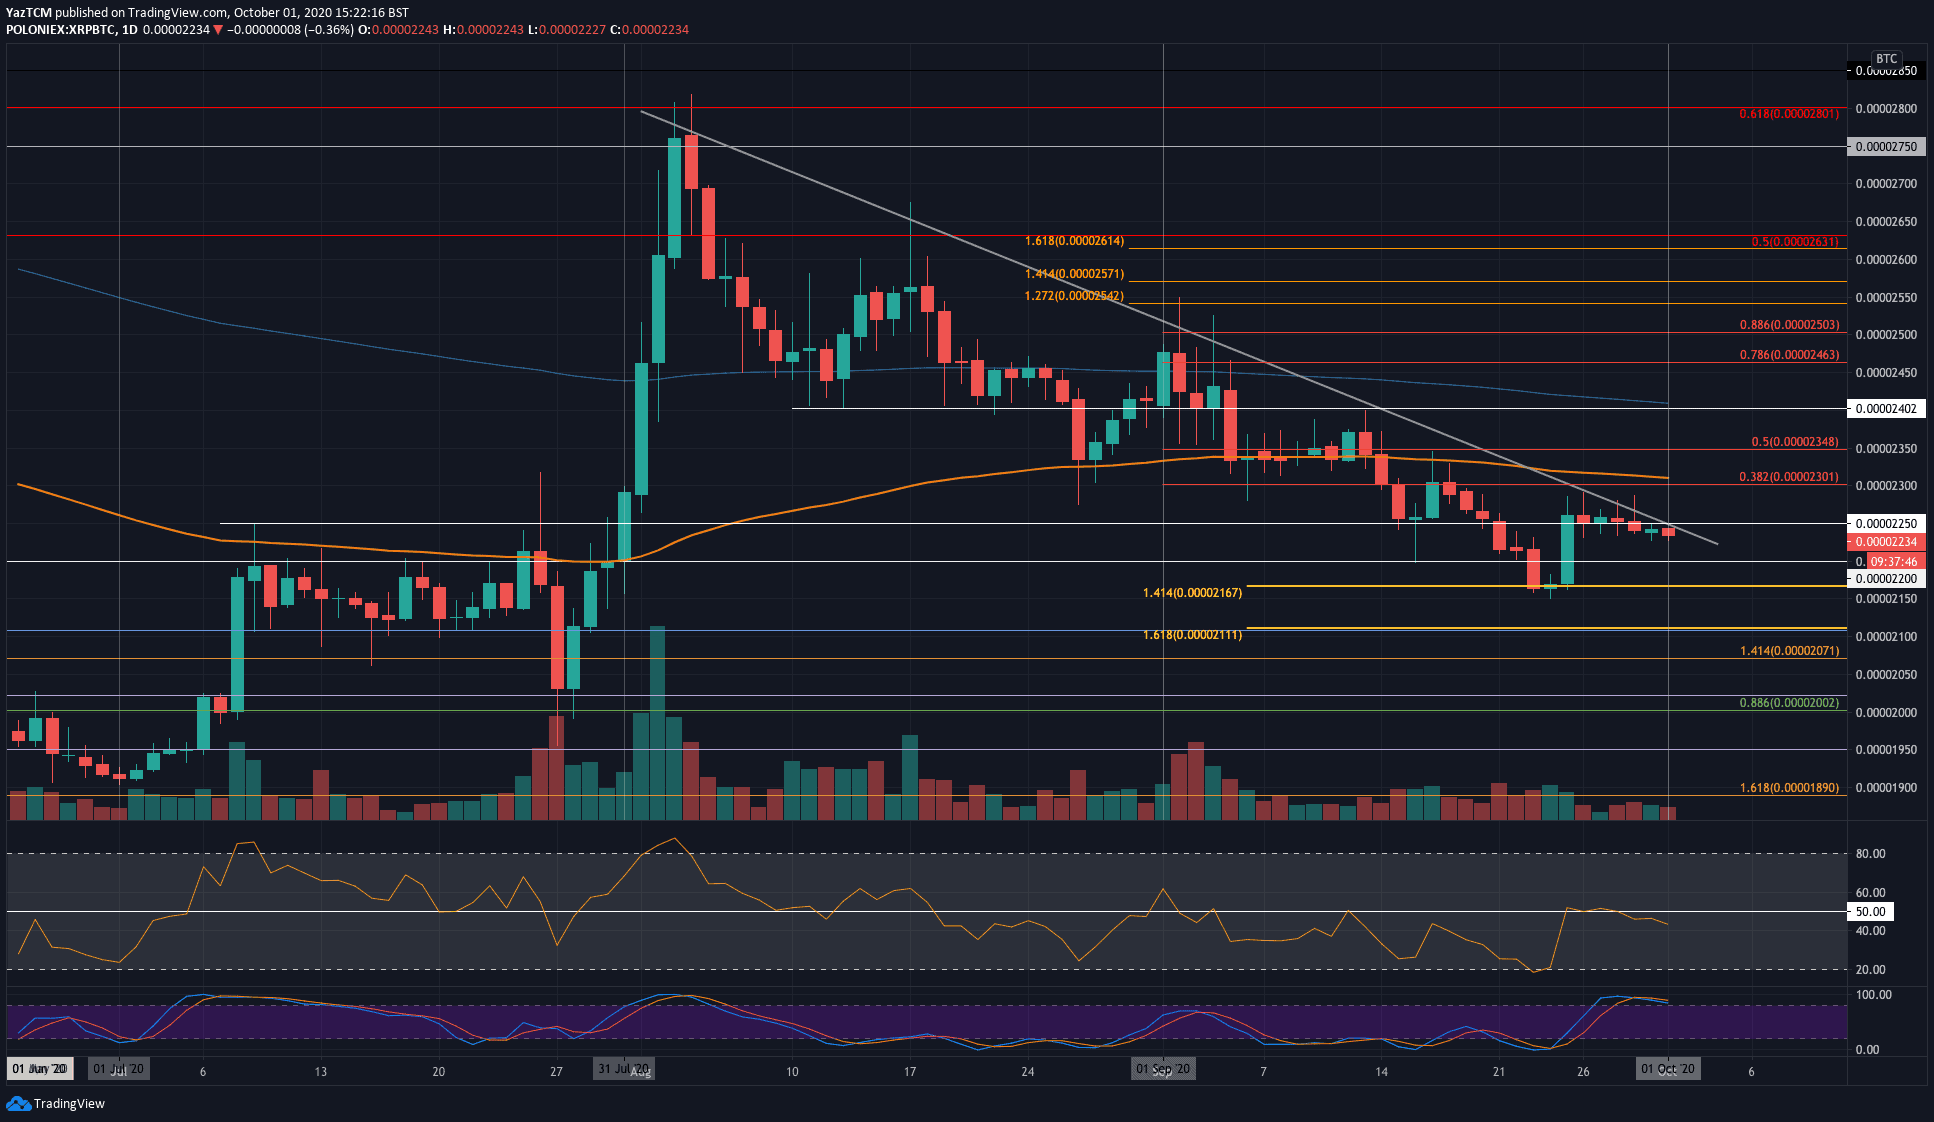
XRP/BTC – Buyers Remain Beneath Falling Trend Line
Key Support Levels: 2200 SAT, 2170 SAT, 2111 SAT.
Key Resistance Levels: 2250 SAT, 2300 SAT, 2350 SAT.
In our last analysis, we had posted that XRP penetrated above a 2-month-old falling trend line. However, the recent sideways movement has now allowed us to re-adjust this trend line, and it appears that the bears are still bound beneath it.
XRP attempted to break this trend line multiple times over the course of this week and failed on each attempt. Yesterday, XRP fell beneath the 2250 SAT level as it looks to head lower again.
XRP-BTC Short Term Price Prediction
If the sellers continue lower, the first level of support lies at 2200 SAT. Beneath this, support lies at 2170 SAT, 2111 SAT, and 2070 SAT.
On the other side, resistance first lies at the falling trend line at around 2250 SAT. Above this, resistance is located at 2300 SAT (bearish .382 Fib Retracement & 100-days EMA), 2350 SAT (bearish .5 Fib Retracement), and 2400 SAT (200-days EMA).
Likewise, the Stochastic RSI is also overbought here and is primed for a bearish crossover signal.
Disclaimer: Information found on CryptoPotato is those of writers quoted. It does not represent the opinions of CryptoPotato on whether to buy, sell, or hold any investments. You are advised to conduct your own research before making any investment decisions. Use provided information at your own risk. See Disclaimer for more information.
The post appeared first on CryptoPotato


