
- Tron rolled back beneath the key support of $0.023 after losing 14% in a day.
- It’s now breaking down from a rising channel to signal a major price correction.
- TRX nosedived after marking 4-month high against Bitcoin.
TRON seems to be on a downhill journey throughout the past 24 hours. Interestingly enough, this takes place a day after they announced that the popular blockchain-based social media Steemit would be joining the TRON network. Unfortunately, the cryptocurrency retraced substantially soon after the news. However, given the overall market condition, it’s perhaps uncorrelated with the announcement.
TRX/USD: Three-Day Correction Sends TRX Back Beneath 5-Month High, Can Buyers Reclaim This Key Resistance?
Key Resistance Levels: $0.026, $0.030
Key Support Levels: $0.0186, $0.016
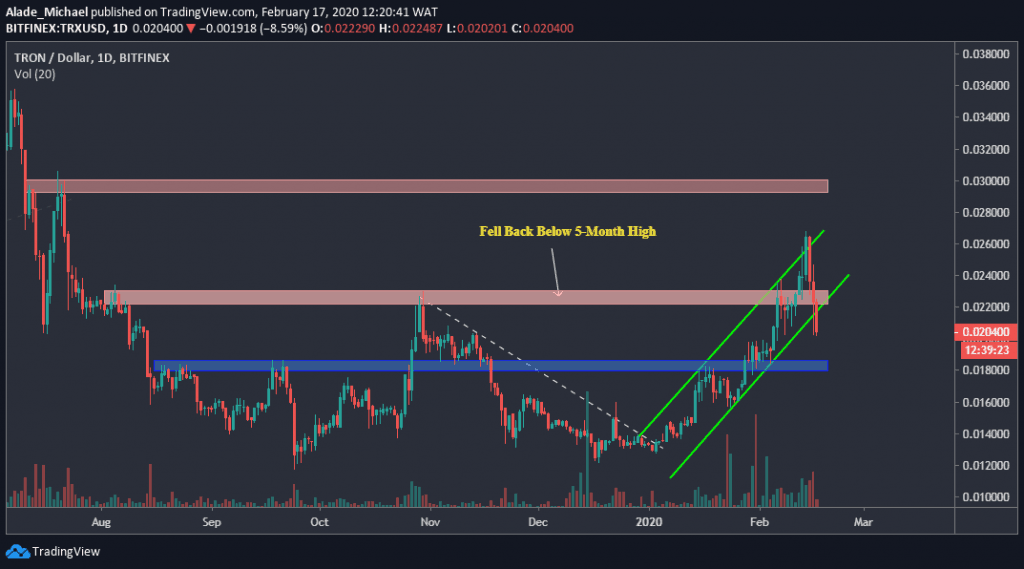
TRX/USD. Source: TradingView
Since our previous price analysis, Tron saw a sharp decline over the weekend and started the week on a bearish note with a 14% drop over the last 24-hours. This bearish correction made the 15th most-traded cryptocurrency to now trade around $0.020 price levels.
TRX price did not just fail to stay above the 5-month high ($0.023) but dipped below the green rising channel that was formed since January, although this break is not clear enough. We need to see a new daily candle close beneath the current one.
Currently, short-term bears are in the market. We can anticipate a quick rebound if TRX can climb back in the channel pattern. If not, volatility may expand to $0.018 before recovering back.
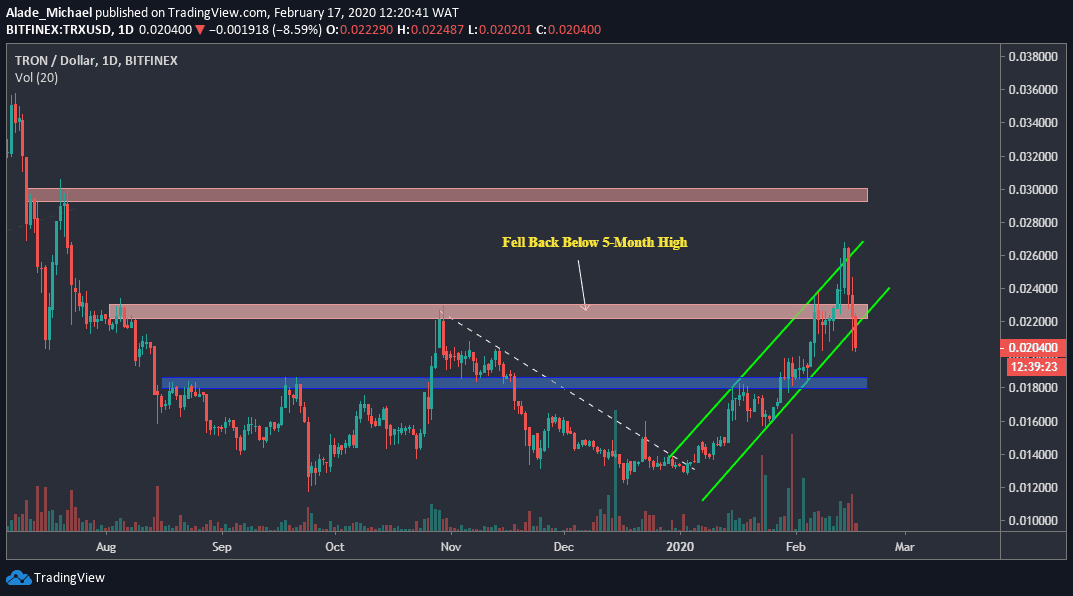
Tron Price Analysis
Looking at the daily chart, Tron is slowly forming a bearish pattern though long-term bullish remains intact. If TRX continues to show weakness below this channel, especially below $0.020, the immediate support to watch out for is $0.018 level – the blue area on the price chart. Right under this support lies the $0.016 level.
In case TRX rebounds at $0.020 or $0.18 support area, the next rally is expected to reach $0.26 (this month’s high) and $0.030 resistance, which was supposed to be the next target for buyers before Tron plunged during the weekend. However, Tron needs to reclaim the $0.023 price area before we can consider a strong buy to the mentioned resistance.
TRXBTC: TRX Sharply Drops Following False Breakout, Can 200SAT Level Hold?
Key Resistance Levels: 246SAT, 259SAT
Key Support Levels: 191SAT, 172SAT
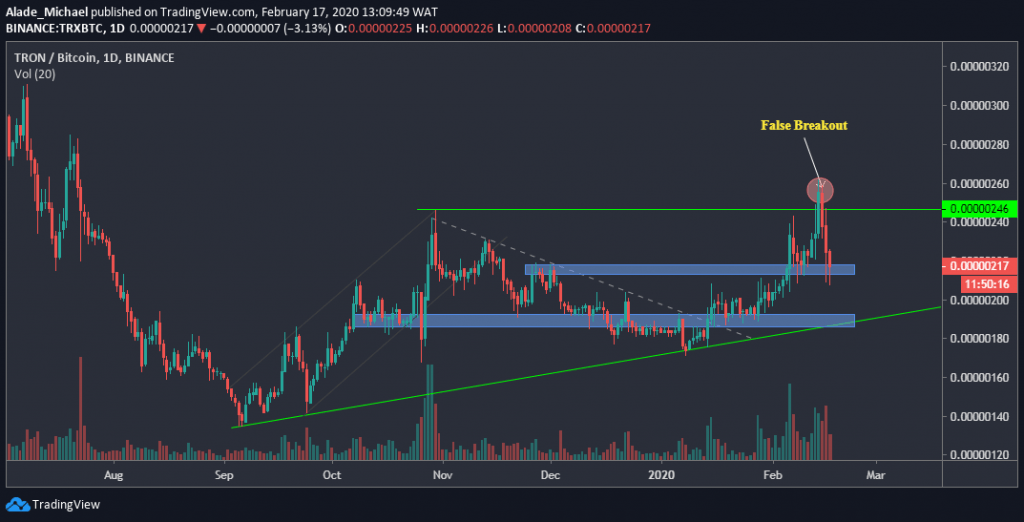
TRX/BTC. Source: TradingView
Tron is undergoing a significant correction against Bitcoin. This correction has led to about 12% losses under 24-hours and almost 20% in three days. Meanwhile, the bullish bias remains dominant and valid for the long-traders. We can anticipate a continuation shortly.
Last week, we mentioned the possible false break above the 246SAT resistance level, which eventually played out accordingly against the Bitcoin pair. As we can see, TRX rolled back beneath this mentioned resistance after marking a new high at around 259SAT level.
The recent selloff got TRX to trade around crucial support of the 217SAT level. If TRX price holds above 200SAT, we could expect a nice recovery. Otherwise, the short-term bearish may last for a while before the buyers charge back.
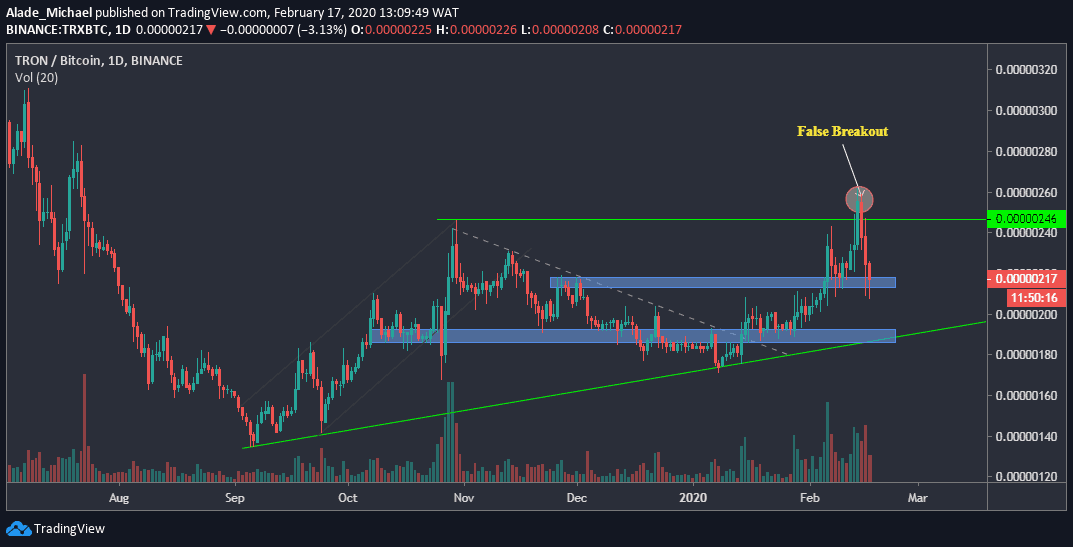
Tron Price Analysis
Following the latest price drops, Tron appeared to be struggling around 210SAT support over the past hours. This current blue zone is a crucial support area for this pair. If TRX fails to start another rally around this support, the next drop level to keep an eye on is 191SAT, right inside the subsequent blue zone. A green ascending trend line also supports this price area.
A slight break beneath the trend line would bring us to January 7 low of 172SAT level. It may lead to a lot of selling pressure if this mentioned price level breaks. If TRX can regain momentum around the current price levels, 246SAT resistance would be the next buying level to watch out for. Reclaiming 259SAT resistance should allow more setups to the 280SAT level.
Click here to start trading on BitMEX and receive 10% discount on fees for 6 months.
Disclaimer: Information found on CryptoPotato is those of writers quoted. It does not represent the opinions of CryptoPotato on whether to buy, sell, or hold any investments. You are advised to conduct your own research before making any investment decisions. Use provided information at your own risk. See Disclaimer for more information.
The post appeared first on CryptoPotato


