
As we are getting closer to the halving event, Bitcoin is likely to mark its third consecutive green day, where the primary cryptocurrency had increased more than $1000 over the past four days. As of writing these lines, it seems like $10K will come in a matter of hours.
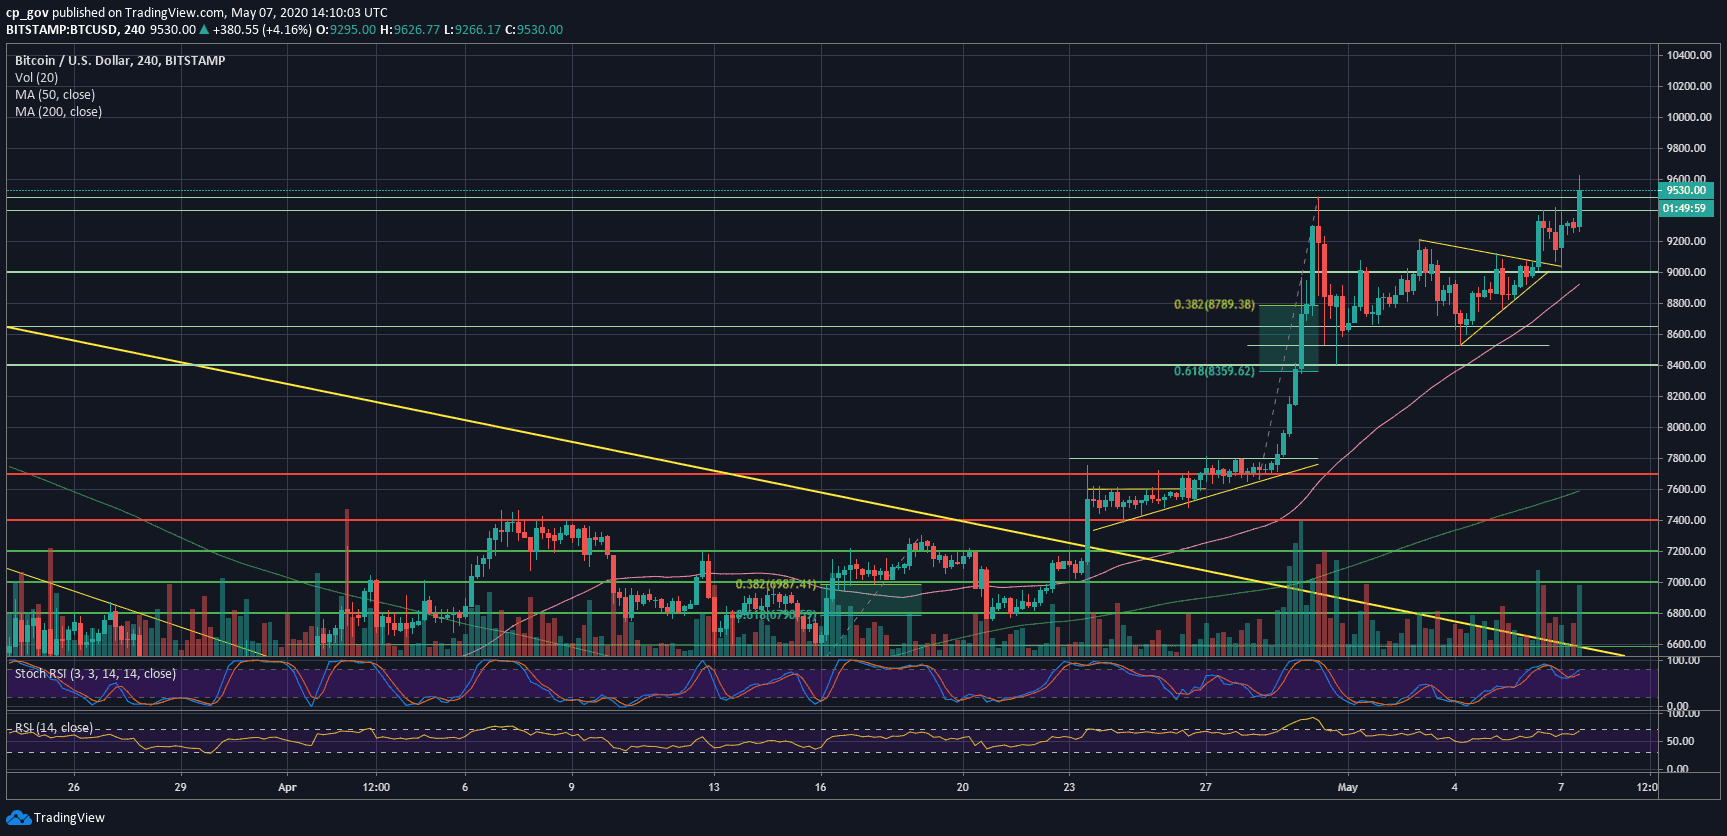
If you had followed our price analysis from yesterday, we had mentioned a symmetrical triangle formation on Bitcoin’s 4-hour chart, and also stated that the triangle is likely to break out in the next few hours.
As can be seen on the following short-term chart, the triangle broke out to the bullish side at around $9070. Since then, the BTC price had reached the resistance level of $9400, went down to confirm the triangle this time as support.
As of writing these lines, Bitcoin skyrockets over $9600. The current daily high now lies at $9630 (Bitstamp); however, this could be changing while you are reading this update.
The critical part is the fact that Bitcoin set a new price record since the end of February, including a full recovery from the devastating price plunge on March 12.
Overall, the indicators are pointing up. The daily RSI is nearing the 80 levels, a decent higher-highs trajectory (which is following the price action), while the volume is also rising.
Update: Thursday, May 7, 18:10 UTC
Yeah, the indicators are indeed bullish, as mentioned here a few hours ago. Bitcoin broke up and reached the confluence zone of $9,800 – $10,000. Bitcoin dominance skyrockets as most altcoins plunge against Bitcoin, and the majority of them are red against the USD as well.
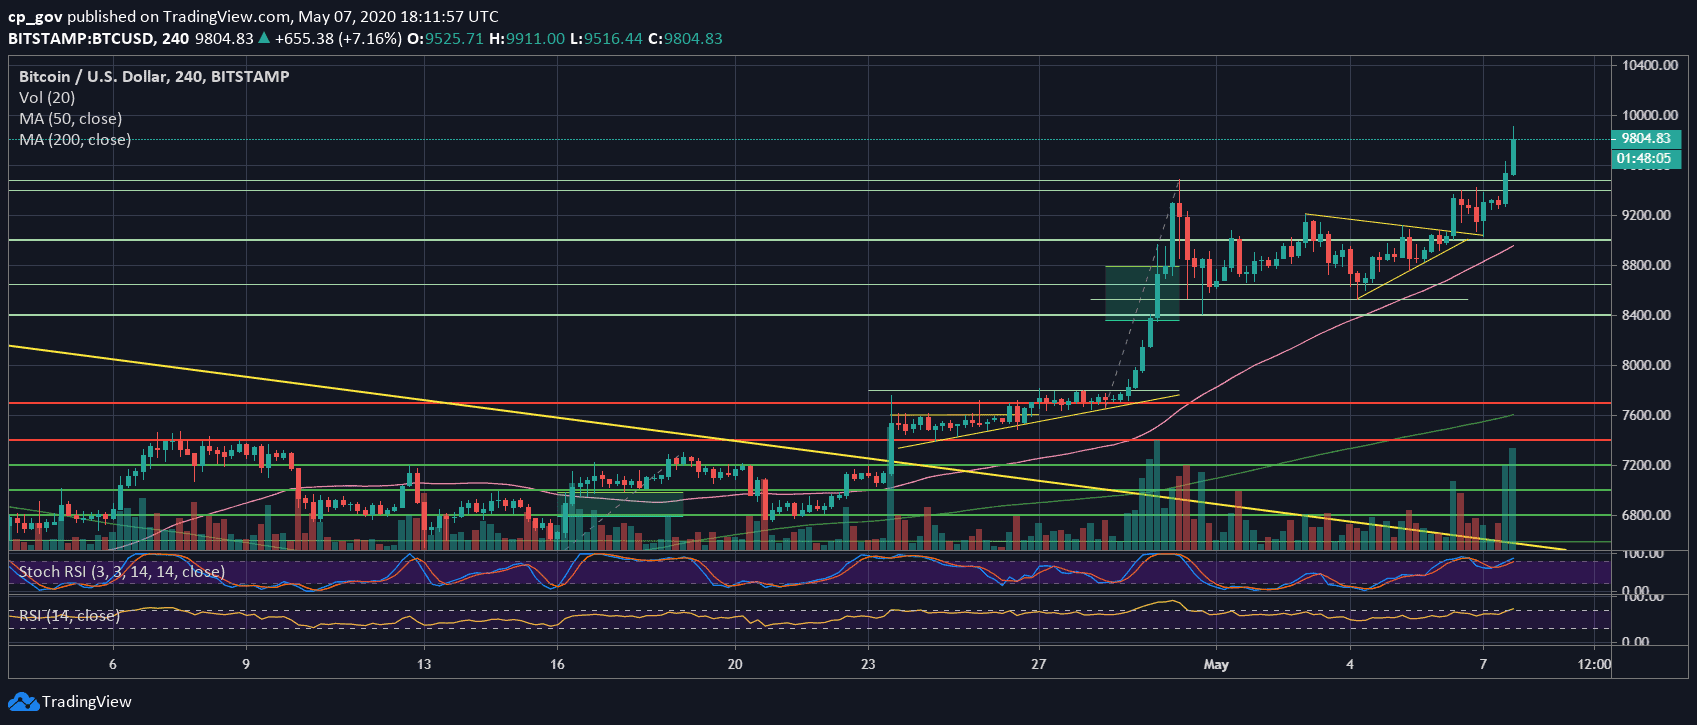
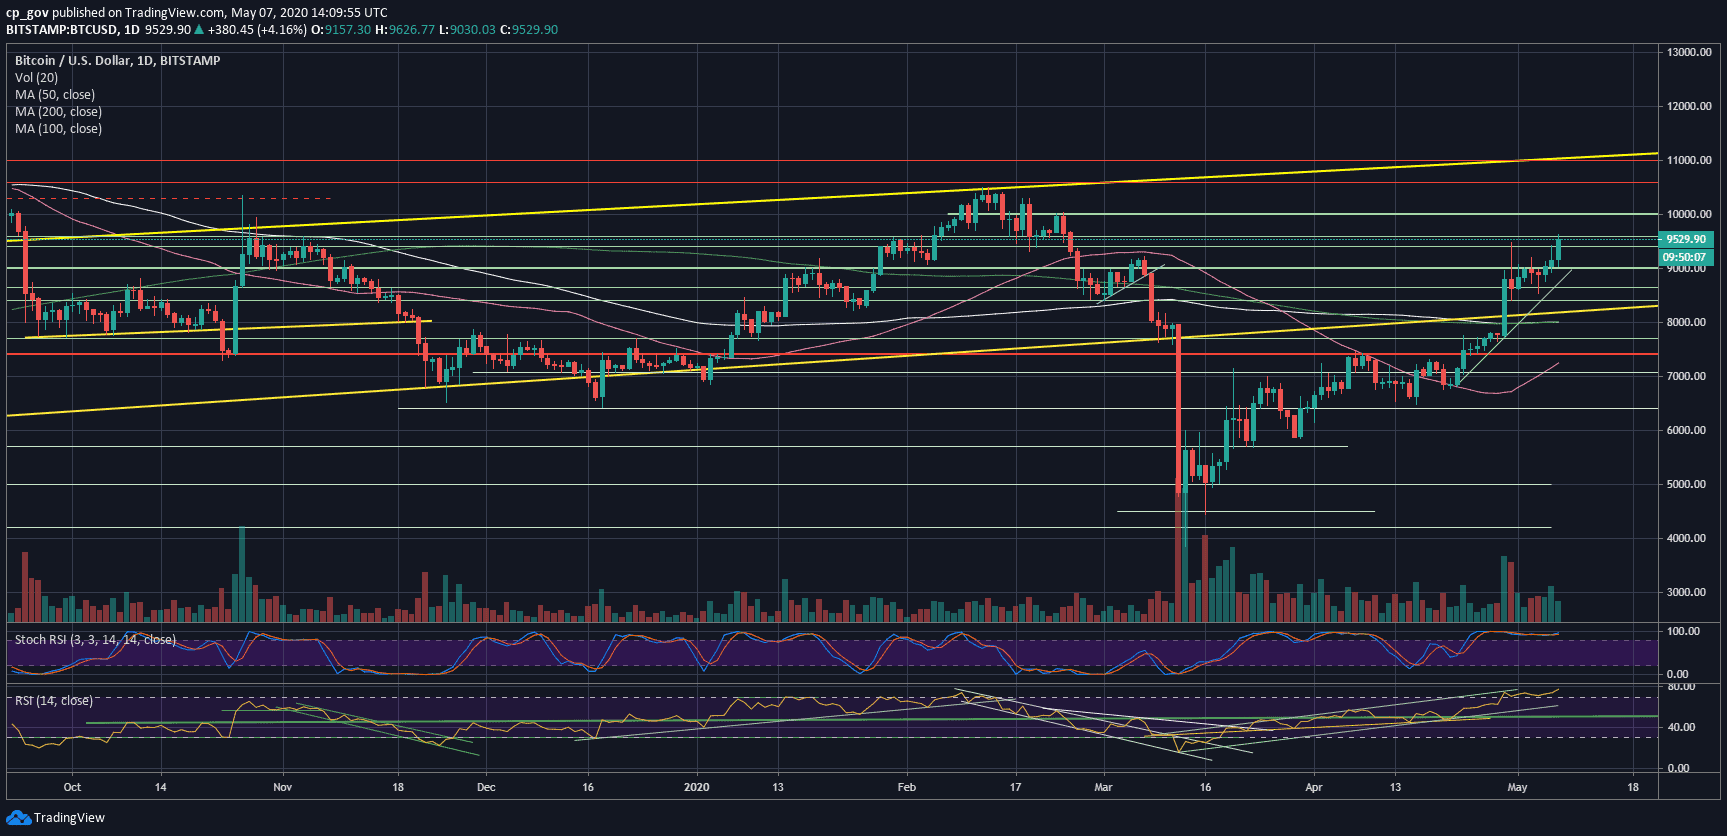
For the longer time frame, after Bitcoin went through a Death Cross on March 24, if the price action continues this way, we will likely to see a bullish Golden cross in a matter of one to two weeks.
As mentioned here yesterday, Bitcoin is crashing the altcoins. As of writing this update, the Bitcoin dominance ratio sets another record – 67.3%. Major altcoins like Ethereum (ETH) and Ripple (XRP) are both recording 11% declines against Bitcoin over the past week, while Tezos (XTZ) sees a 15% price drop at the same period.
Total Market Cap: $257 billion
Bitcoin Market Cap: $173.5 billion
BTC Dominance Index: 67.3%
*Data by CoinGecko
Bitcoin’s Real Test Since December 2017
Following the breakout of the previous high at $9400 – $9500, this level now becomes the first significant support. Down below lies $9200, followed by $9000 and $8800.
From above, it gets interesting.
The first resistance lies around $9600, which is the current daily high, whereas the real test will be the price range between $9800 and $10,000. This is a long-term weekly descending trend-line, which started forming in December 2017 – Bitcoin’s all-time high at almost $20K. In case that Bitcoin breaks through, the first resistance above the 5-digits number lies at $10,300 – $10,400.
BTC/USD BitStamp Weekly Chart

BTC/USD BitStamp 4-Hour Chart
BTC/USD BitStamp 1-Day Chart
The post Updated: Bitcoin Price Soars To New 2-Month High: But This 2017 Resistance Can Make Some Trouble Before $10,000 (Price Analysis) appeared first on CryptoPotato.
The post appeared first on CryptoPotato


